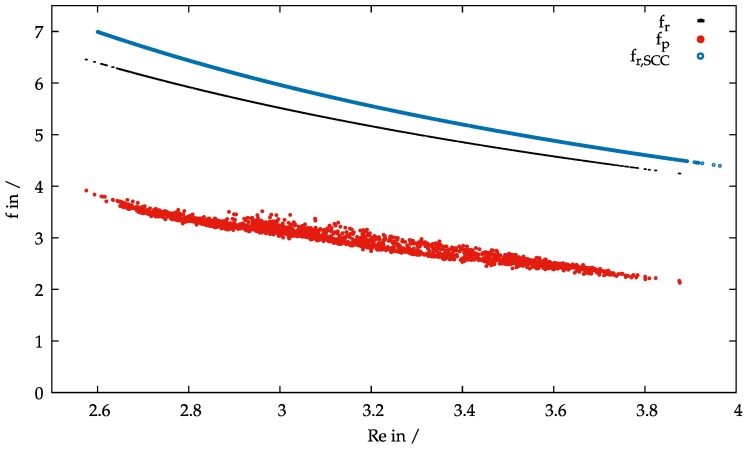
Figure 9.
Fanning friction factor f plotted over Reynolds number Re for data from rheological measurements: and from pressure losses . For comparison, for the rheological data from an SCCin the same Reynolds number range is plotted with the rheological data given in Section 2.

