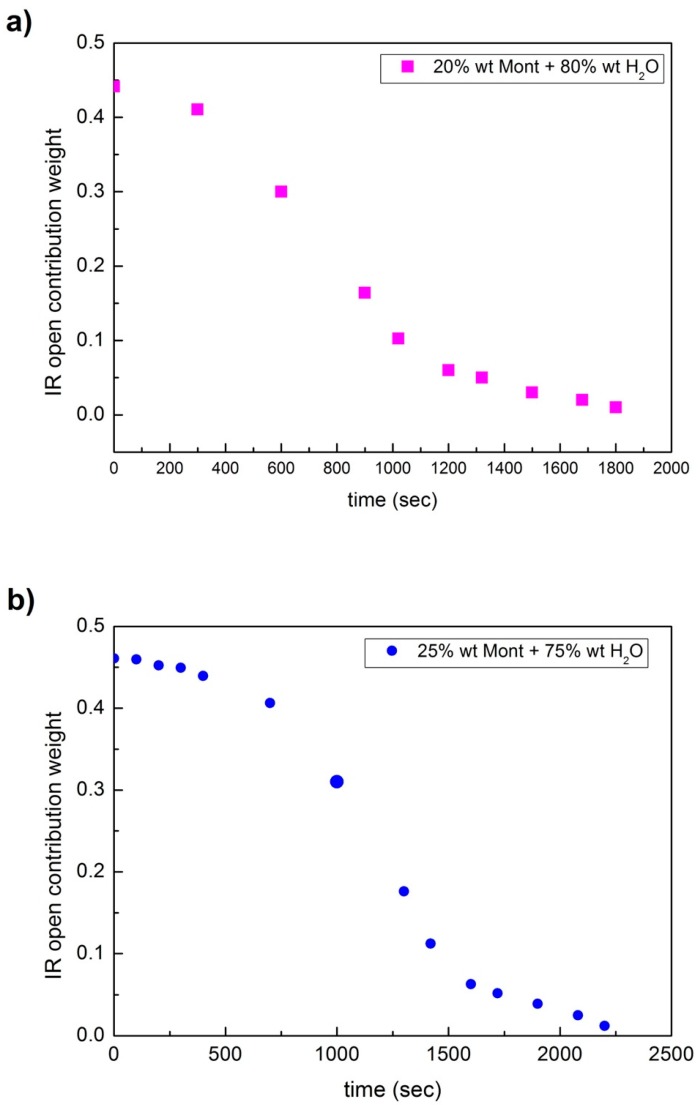
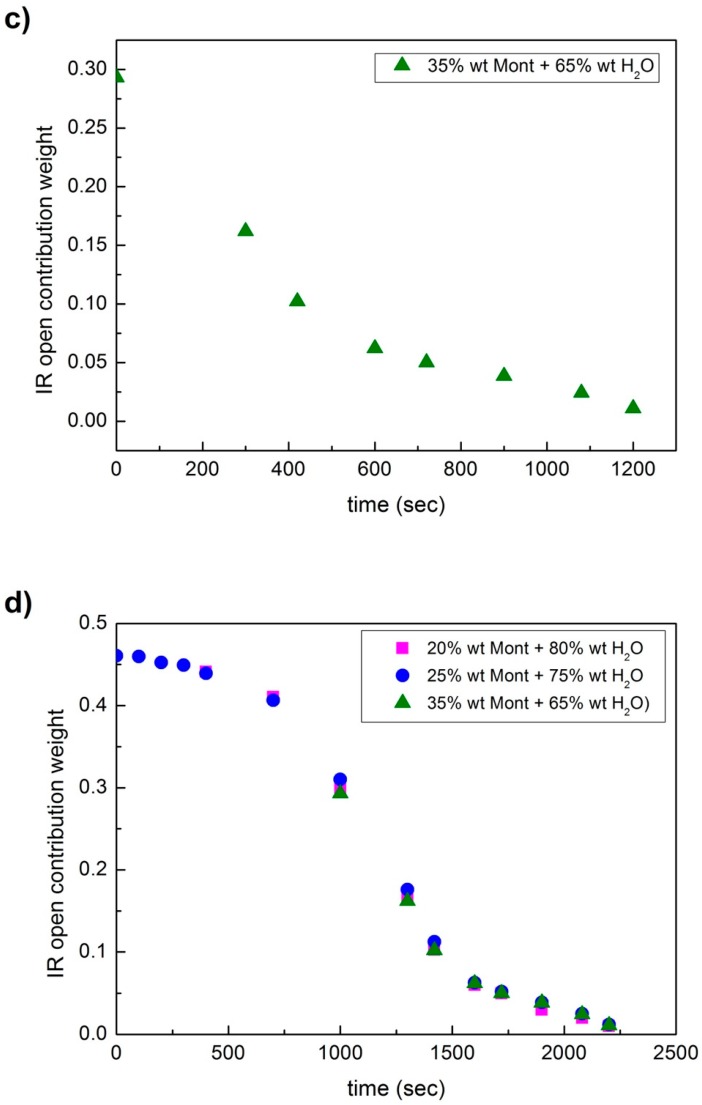
Figure 7.
Behavior of the weights of the open contribution as a function of time for a concentration value of: (a) 20 wt% of montmorillonite and 80 wt% of water; (b) 25 wt% of montmorillonite; and 75 wt% of water; and (c) 35 wt% of montmorillonite and 65 wt% of water; finally, (d) data obtained starting from the three different concentration values, scaled along the time axis; as it can be seen, the data follow the same trend.


