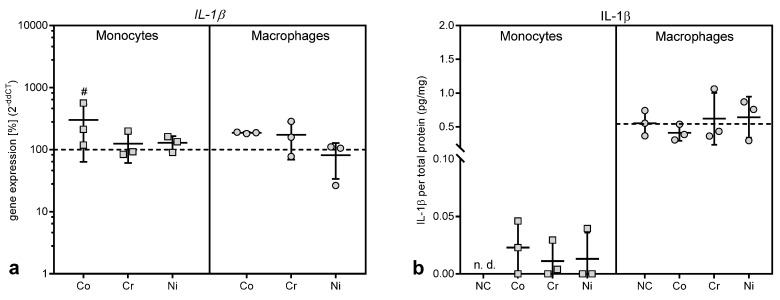
Figure 5.
Gene expression and protein release of interleukin (IL-) 1β following exposure to metal salts. Gene expression (a) and protein release into cell culture supernatants (b) was determined for THP-1 monocytes and macrophages after 48 h of treatment with the concentration of 100 µM of cobalt, chromium and nickel salts. Untreated cells served as negative controls. Data (n = 3) are depicted as single datapoints with mean ± SD. Gene expression data are shown as percentage of untreated cells (2(−∆∆Ct), 100%, dotted line), while protein release data represent values of the specific protein amount normalized to total protein content in cell culture supernatants. Significances between groups were calculated with two-way ANOVA with Bonferroni post hoc test using ∆CT values for gene expression and specific protein amount normalized to total protein content for protein release in cell culture supernatants. Significantly different from untreated control: # p < 0.05, ## p < 0.01, ### p < 0.001. Abbreviations: n.d. = not detectable; NC = negative control (untreated cells).

