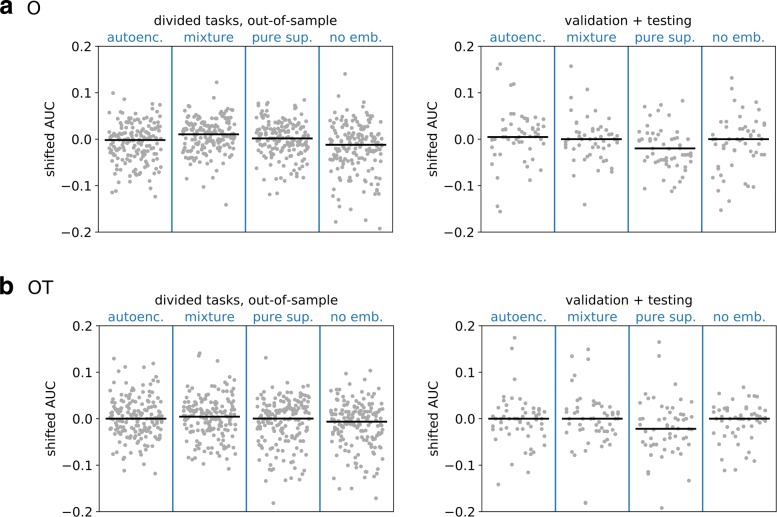
Fig. 6.
Performance for semi-supervised models. The binary task performance is shown for four different types of embedding models across two different datasets and two different gene sets. The four models are a purely unsupervised autoencoder (autoenc.), a semi-supervised embedding model (mixture), a purely supervised embedding model (pure sup.), and a no-embedding model (no emb.). To train the supervised component of the embedding models, specific task datasets are divided into two halves, one contributing to the supervised loss in training, and the other held out; the performance of the four models on the held-out halves are shown in the left column. The performance of the same models on the validation and testing tasks (which take no part in training any embedding model) are shown in the right column. Models on the O gene set are shown in the upper row, and on the OT gene set in the lower row. The gray points show the shifted AUCs on all tasks in each group and all model types, which include all supervised model types and all transforms. The bars show the median score

