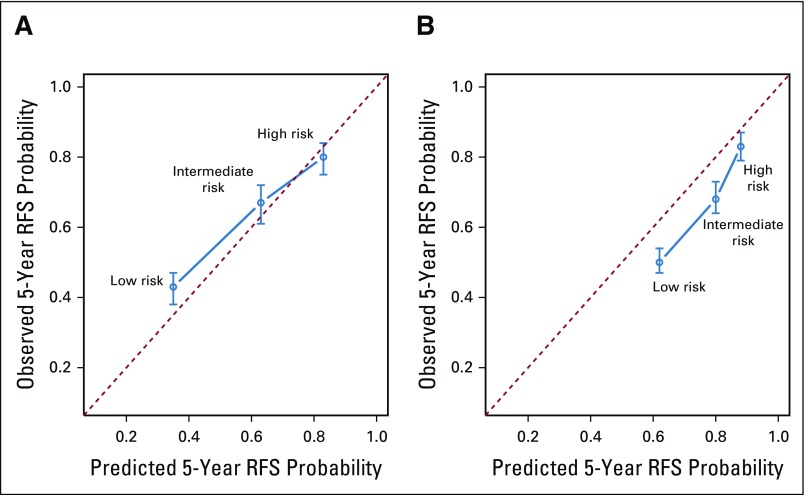
FIG 2.
Calibration plot of the Memorial Sloan Kettering Cancer Center (MSKCC) and Kattan nomograms for the entire cohort of 1,647 patients. Three risk categories were estimated on the basis of the model outputs (low, intermediate, and high). Estimates above the dashed line represent underestimates; those below the dashed line represent overestimates. RFS, recurrence-free survival.

