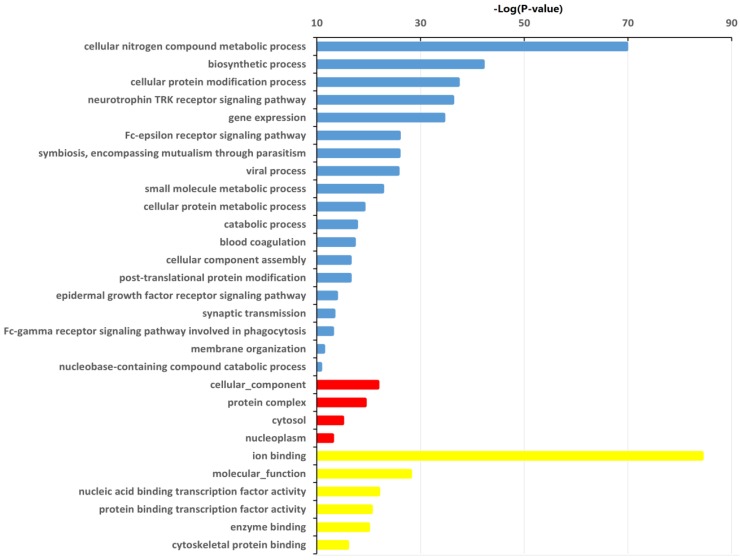
Figure 3.
Significantly changed GO categories of predicted target genes of deregulated miRNAs between HepG2/IR and HepG2 cells. The y-axis shows GO category and the x-axis shows -lgP. The larger -lgP indicated a smaller P value. -lgP represent the negative logarithm of the P value. Blue bars indicate biological process (BP), red bars indicate cellular component (CC) and yellow bars indicate molecular function (MF).

