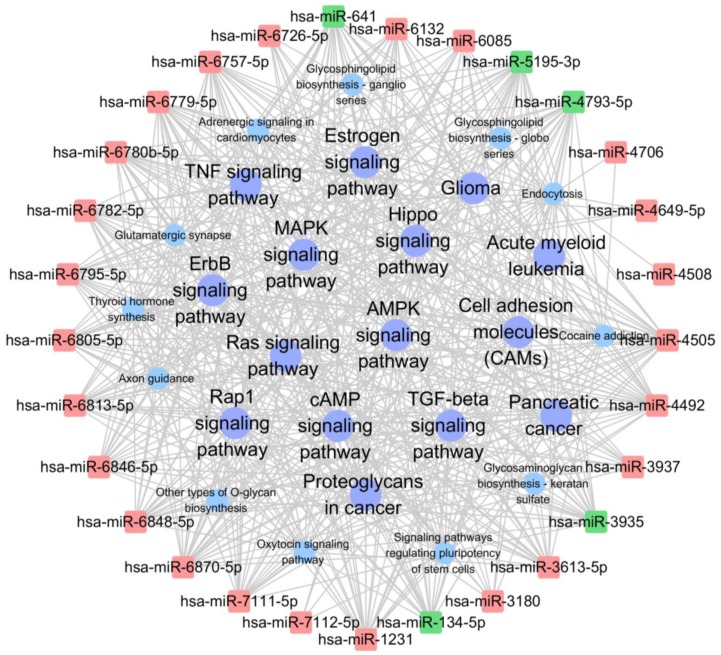
Figure 7.
miRNA-KEGG network showing the interactions between key miRNAs and the hub KEGG pathway. The square nodes represent miRNAs (red nodes denote up-regulated miRNAs, green nodes denote down-regulated miRNAs), circular nodes represent hub KEGG pathway with degree>30 (purple nodes denote tumor related hub KEGG).

