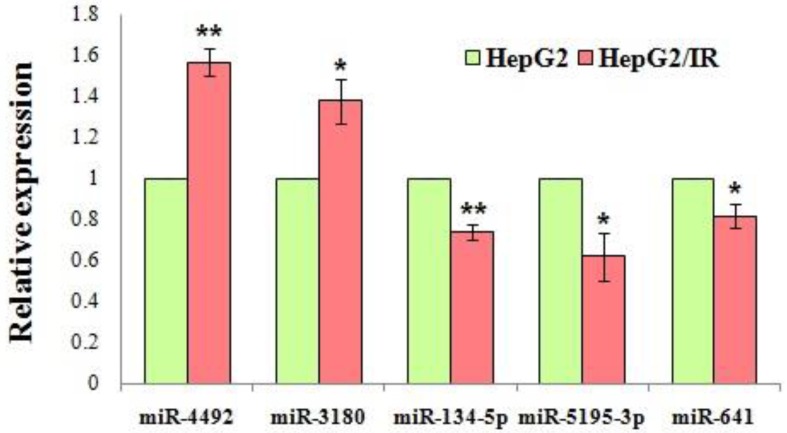
Figure 8.
Validation of the microarray results by qRT-PCR. Expression level of the dysregulated miRNAs were shown in the figure. All miRNAs exhibited statistically significant changes in the HepG2/IR cells compared with its parental cells. Relative expression levels were calculated by 2-ΔΔCt method after the (cycle threshold) Ct value (power amplification knee point) was obtained. Experiments were repeated three times with similar results, and the results are presented as mean±SD of triplicate experiments. *P<0.05, ** P<0.01.

