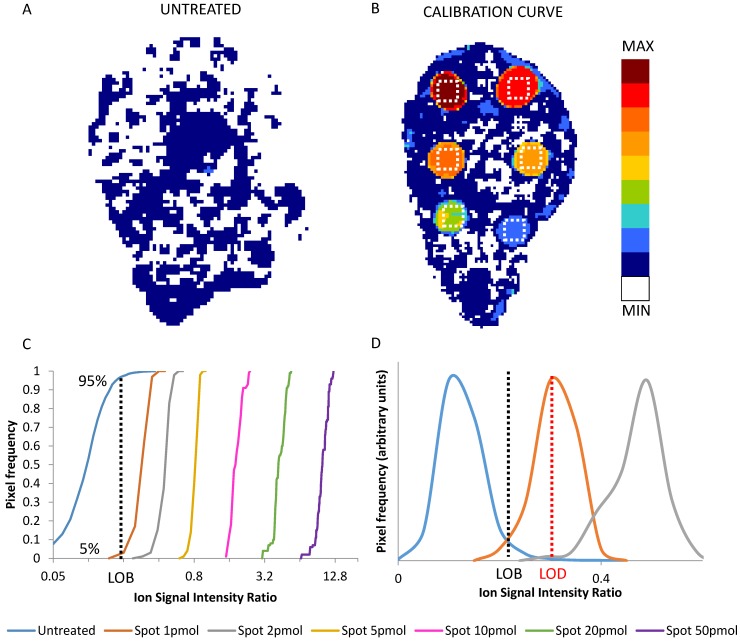
Figure 1.
2D images of the normalized niraparib ion signal after application of the median filter (3x3) in an untreated tumor (A) and in a calibration curve section (B). The dotted white square depict the 100 pixel ROIs taken into account for calibration. Cumulative distribution of normalized drug-related signals in the pixel of untreated tumor and of the ROIs of each calibration spot (C). The value at 95% of the distribution of untreated tumor (dotted black line) corresponds to the LOB. The LOD correspond to the mean of first distribution whose only the 5% is under the LOB (D). In this example the LOD is the mean of the signals of spot 1pmol (dotted red line).

