Figure 1.
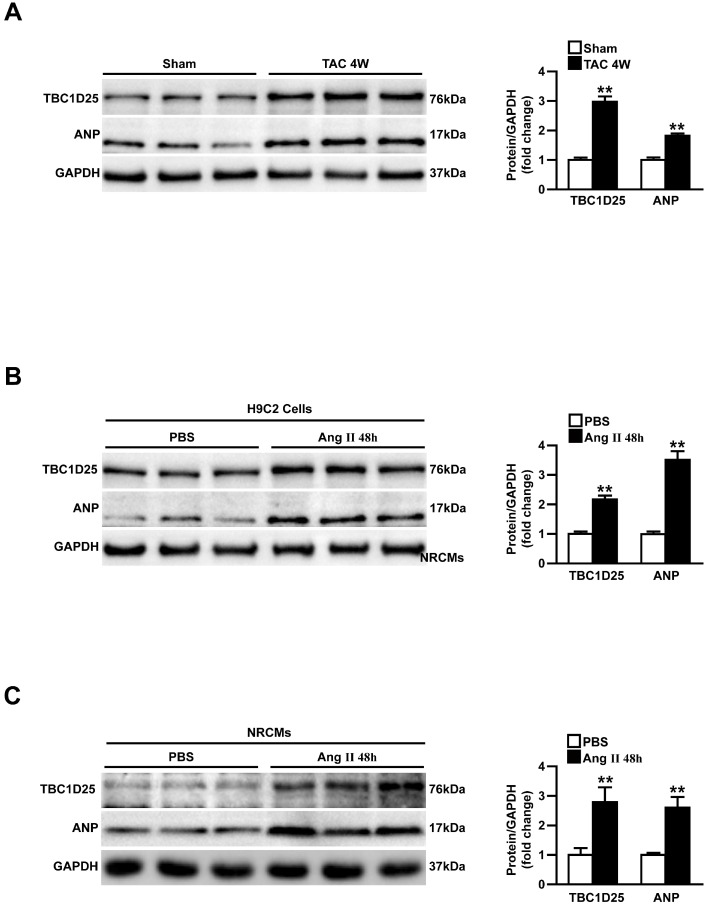
Upregulation of TBC1D25 expression in model of cardiac hypertrophy. (A) Western blots (left) and quantification (right) of TBC1D25 and ANP protein levels from WT mice subjected to sham surgery or TAC-induced cardiac hypertrophy at 4 weeks, n =3 mice per experimental group. Two-tailed Student's t-test. **P<0.01 vs sham. (B-C) The TBC1D25 and ANP protein levels of H9C2 cardiomyocytes or neonatal rat cardiomyocytes (NRCMs) in phosphate-buffered saline (PBS) controls, and Ang II-treated groups at 48 hours. Data are representative of at least 3 independent experiments. Two-tailed Student's t-test. **P<0.01 vs sham. All data are presented as mean ±S.D.

