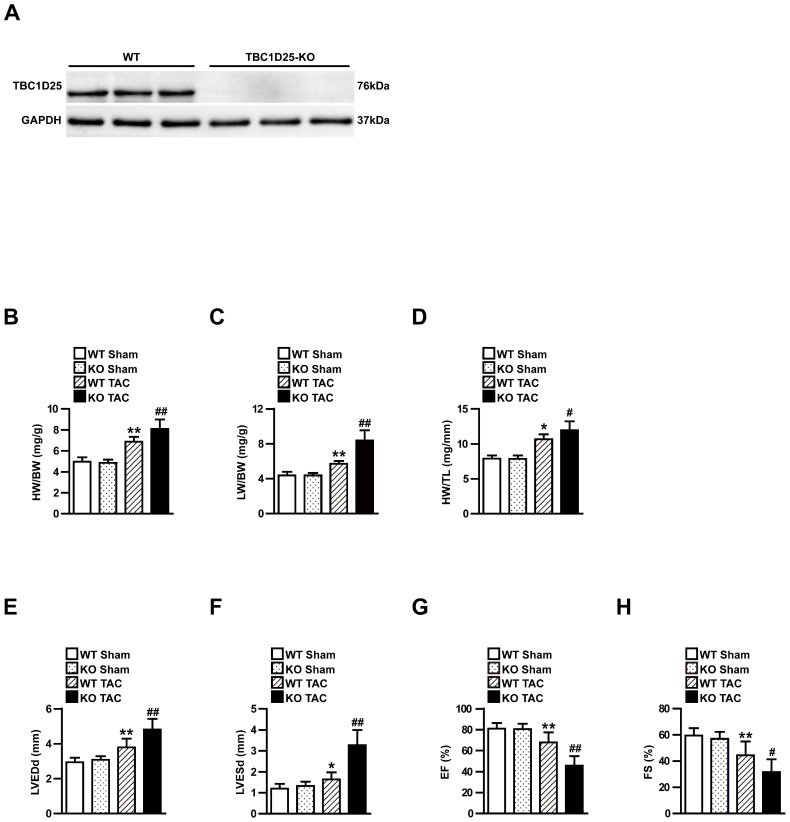
Figure 2.
TAC-induced cardiac hypertrophy in WT and TBC1D25-KO mice. (A) The comparison of TBC1D25 expression in TBC1D25-KO mice and WT control mice. (B-D) The ratios of heart weight (HW)/body weight (BW), lung weight (LW)/BW, and HW/tibia length (TL) in WT and TBC1D25-KO mice at 4 weeks after sham or TAC surgery. n=11 in per groups. (E-H) Left ventricular end-diastolic diameter (LVEDd), left ventricular end-systolic diameter (LVESd), EF% and FS% were measured by echocardiography in WT and TBC1D25-KO mice subjected to sham or TAC. n=11 mice per experimental group. The data were analysed with two-tailed Student's t-test. *P<0.05 vs WT sham, **P<0.01 vs WT sham, #P<0.05 vs WT TAC, ##P<0.01 vs WT TAC. All data are presented as mean ±S.D.

