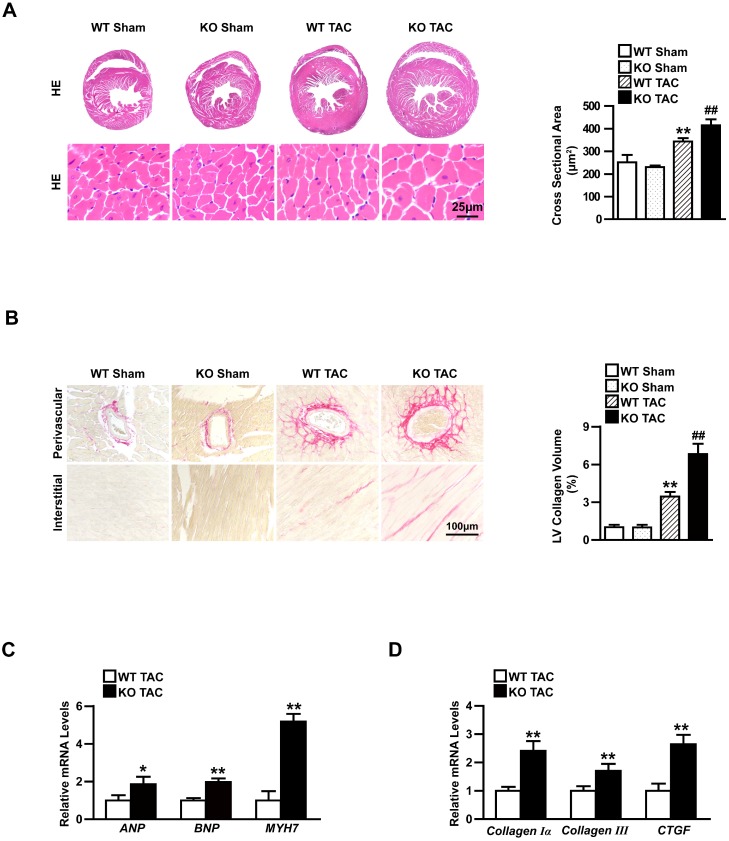
Figure 3.
Knockout TBC1D25 exacerbates cardiac hypertrophy induced by increasing afterload in left ventricle. (A) Hematoxylin and eosin staining (left) and quantification (right) of WT and TBC1D25-KO mice hearts after 4 weeks of sham or TAC. Left, n=6 mice per experimental group. Right, n=100-200 cells per experimental group. Scale bars 50 μm. (B) Picrosirius red (PSR) stained perivascular and interstitial area (left) and LV collagen volume (right) in each group. Left, n=6mice per experimental group. Right, n=50 fields per experimental group. Scale bar, 100 μm. **P<0.01 vs WT sham, ##P<0.01 vs WT TAC. (C-D) The mRNA levels of hypertrophic markers (ANP, BNP, and MYH7) and fibrotic markers (Collagen Iα, Collagen III and CTGF) in the hearts of WT and TBC1D25-KO mice after TAC treatment. n=3-4 mice per experimental group. Two-tailed Student's t-test. *P<0.05 vs WT group, **P<0.01 vs WT group. All data are presented as mean ±S.D.

