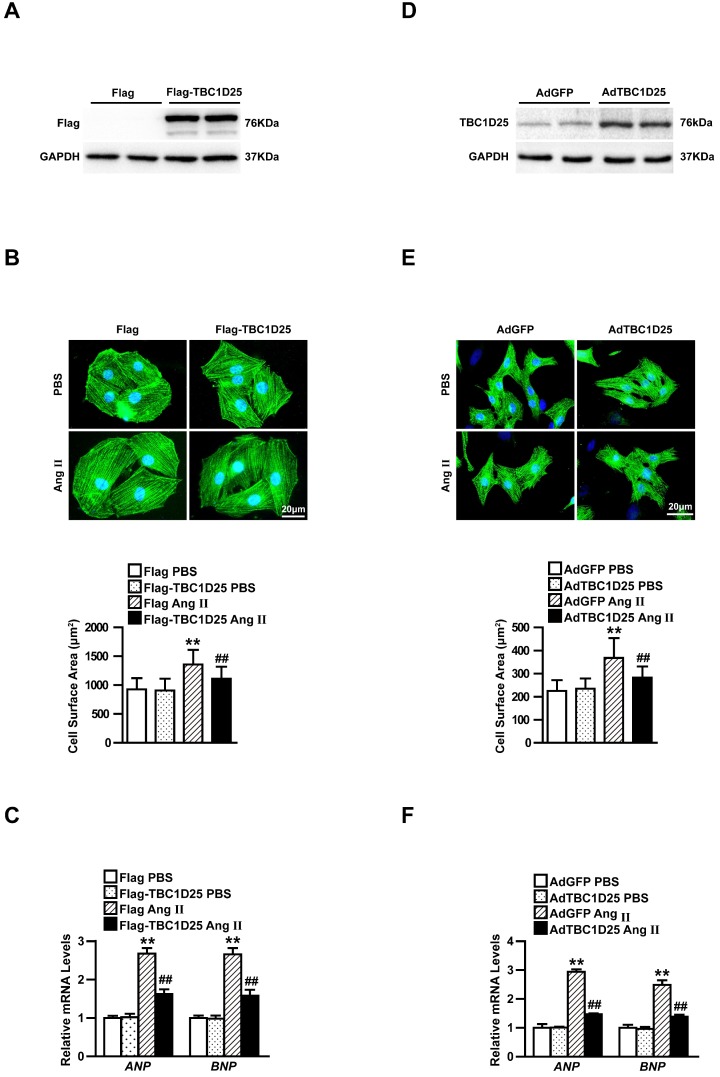
Figure 4.
TBC1D25 affects Ang II-induced cardiomyocyte hypertrophy in vitro. (A) Immunoblotting of Flag-TBC1D25 in H9C2 cardiomyocytes. n = 2 samples per group. (B) Representative images of α-actinin (green) and DAPI (blue) stained H9C2 cells in each group treated with PBS or Ang II (above). Quantification of cell surface area (below). Above, n=3 independent experiments. Below, n=50 cells per group. Scale bar, 20 μm. (C) Relative mRNA expression of ANP and BNP in each group treated with Ang II or PBS. n=3 independent experiments. One-way ANOVA. **P<0.01 vs Flag PBS group, ##P<0.01 vs Flag Ang II group. (D) NRCMs infected with AdTBC1D25 and control (AdGFP) were analyzed by Western blotting. (E) Representative images of NRCMs infected with AdTBC1D25 or AdGFP after treatment with Ang II or PBS (above). Quantification of cell surface area (below). Above, n=3 independent experiments. Below, n=50 cells per group. Scale bar, 20 μm. (F) ANP and BNP mRNA levels in NRCMs treated Ang II or PBS. n=3 independent experiments. One-way ANOVA. **P<0.01 vs AdGFP PBS group, ##P<0.01 vs AdGFP Ang II group. All data are presented as mean ±S.D.

