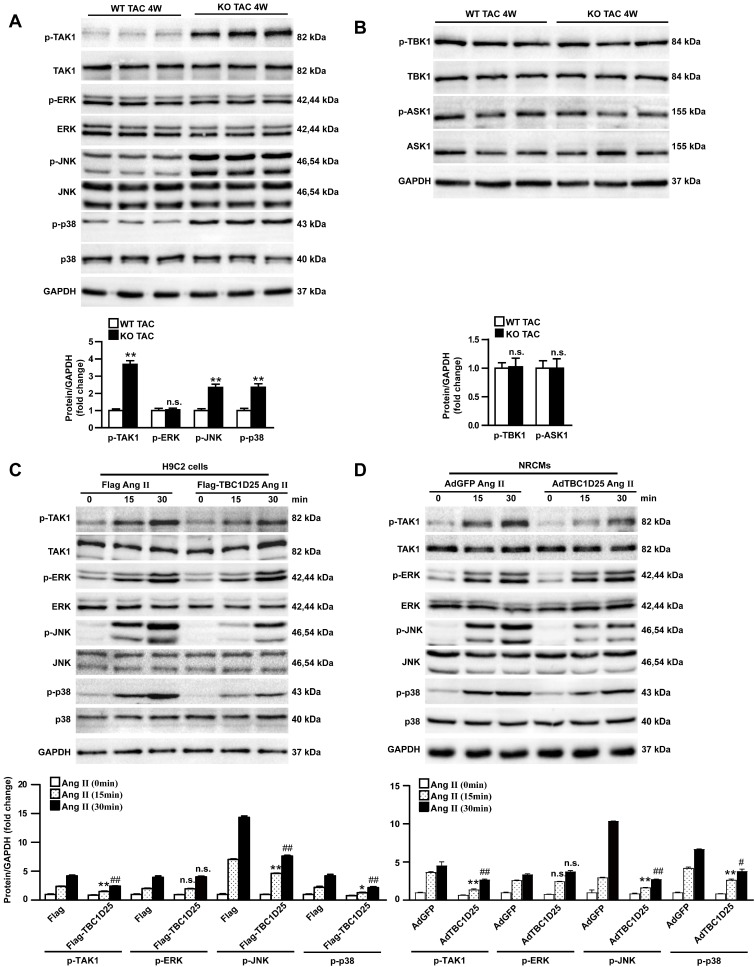
Figure 5.
TBC1D25 inhibits TAK1signalling pathway. (A) Representative western blots (top) and quantification (bottom) of phosphorylated and total TAK1, ERK, JNK and p38 in WT and TBC1D25-KO mice subjected to TAC. n=3 mice per experimental group. (B) Representative western blots (top) and quantification (bottom) of phosphorylated and total TBK1 and ASK1 in WT and TBC1D25-KO mice subjected to TAC. n= 3 mice per experimental group. Two-tailed Student's t-test. **P<0.01 vs WT group. n.s. indicates no significance. (C) Representative western blots (top) and quantification (bottom) of phosphorylation and total TAK1, ERK, JNK and p38 in H9C2 cardiomyocytes infected with lenti-GFP or lenti-TBC1D25 and treated with Ang II for the indicated times. n=3 independent experiments. One-way ANOVA. *P<0.05 vs Flag Ang II (15min) group, **P<0.01 vs Flag Ang II (15min) group, ##P<0.01 vs Flag Ang II (30min). n.s. indicates no significance. (D) Representative western blots (top) and quantification (bottom) of phosphorylation and total TAK1, ERK, JNK and p38 in NRCMs infected with AdGFP or AdTBC1D25 and treated with Ang II for the indicated times. n=3 independent experiments. One-way ANOVA. **P<0.01 vs AdGFP Ang II (15min) group, #P<0.05 vs AdGFP Ang II (30min) ##P<0.01 vs AdGFP Ang II (30min). n.s. indicates no significance. All data are presented as mean ±S.D.

