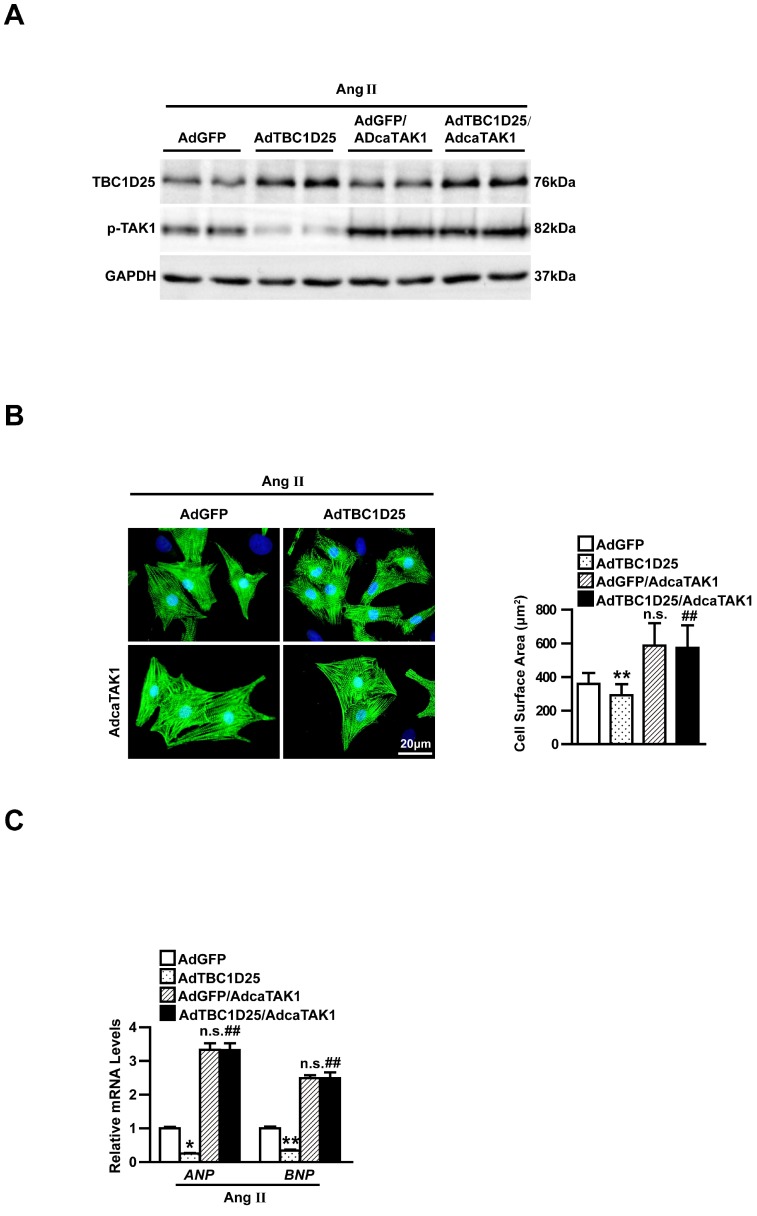
Figure 6.
Activated TAK1 reverses the protective effects of TBC1D25 on cardiomyocytes hypertrophy induced by Ang II. (A) Representative western blots of TBC1D25 and in AdGFP, AdTBC1D25, AdGFP+AdcaTAK1 or AdTBC1D25+AdcaTAK1 infected NRCMs. (B) Representative images of cardiomyocytes (immunostained with the α-actinin antibody) infected with AdGFP, AdTBC1D25, AdGFP+AdcaTAK1 or AdTBC1D25+AdcaTAK1 after treatment with Ang II (left). Quantification of cell surface area (right). Left, n=3 independent experiments. Right, n=50 cells per group. Scale bar, 20 μm. (C) ANP and BNP mRNA levels in NRCMs treated Ang II in each group. *P<0.05 vs AdGFP group, **P<0.01 vs AdGFP group, ##P<0.01 vs AdTBC1D25 group. n.s. indicates no significance.

