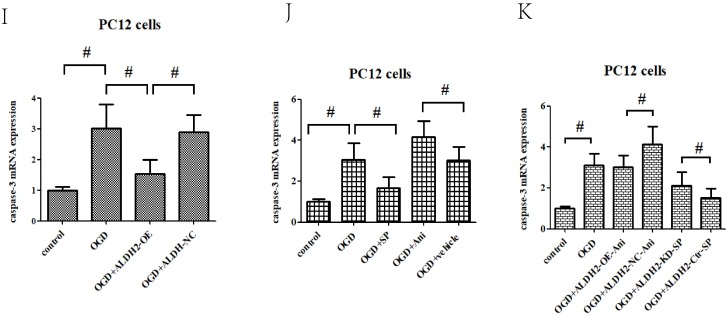
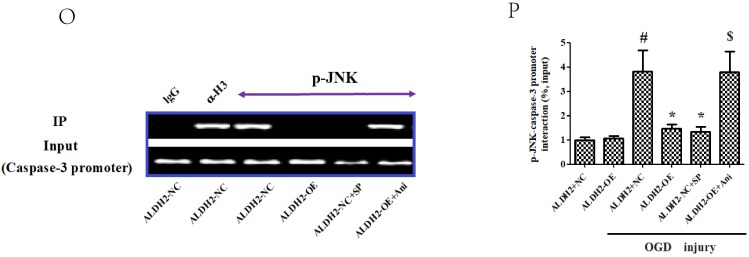
Figure 8.
ALDH2/JNK modified caspase-3 transcription. A and B. Plasmid transfection or siRNA overexpressed or knockdown JNK expression, respectively, and representative gel blots of expression of JNK, using specific antibodies in the primary cortical neurons. C and D. Overexpression or inhibition of JNK modulated neuronal viability. E. Overexpression or inhibition of JNK regulated mROS generation. F. Overexpression or inhibition of JNK mediated caspase-3 activity. G. Representative gel blots of expression of active caspase-3. H. Overexpression or inhibition of JNK mediated the contents of caspase-3mRNA. I-K. qPCR assay for the differences of caspase-3 mRNA expression. L. The level of caspase-3 mRNA during hypoxia and at different time points after reoxygenation. M and N. Representative gel blots of expression and quantification analysis of phosphorylated JNK and active caspase-3. O and P, ChIP assay suggested interaction between the caspase-3 promoter and p-JNK under OGD injury. IgG was applied as a negative control, while anti-histone-3 (α-H3) was used as a positive control. Input corresponds to equal amplification of DNA in non-immunoprecipitated samples; IP demonstrated the amplified DNA band in the immunoprecipitated samples. Mean ± SD was used to describe the data; *P < 0.05, compared to OGD+ALDH2-NC group; #P <0.05, compared to the ALDH2-NC group; $ P < 0.05, compared to OGD+ALDH2-OE group.


