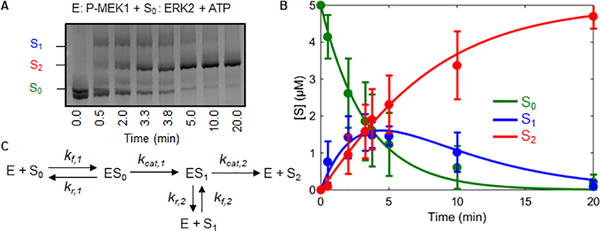
Figure 1. Determining kinetic parameters for MEK activation of ERK.
A) Kinetics of ERK phosphorylation by active wild type MEK. The three different ERK phosphostates were quantified via phostag gels. S0, S1, S2 represent unphosphorylated, monophosphorylated, and dually phosphorylated ERK respectively. B) Model fit to the kinetic data. The error bars indicate the standard deviation of the 12 replicates. The lines show a fit to the reduced model (Figure 2A) obtained using Bayesian inference. C) General model describing the mechanism by which a kinase phosphorylates a substrate with two ordered phosphorylation sites.

