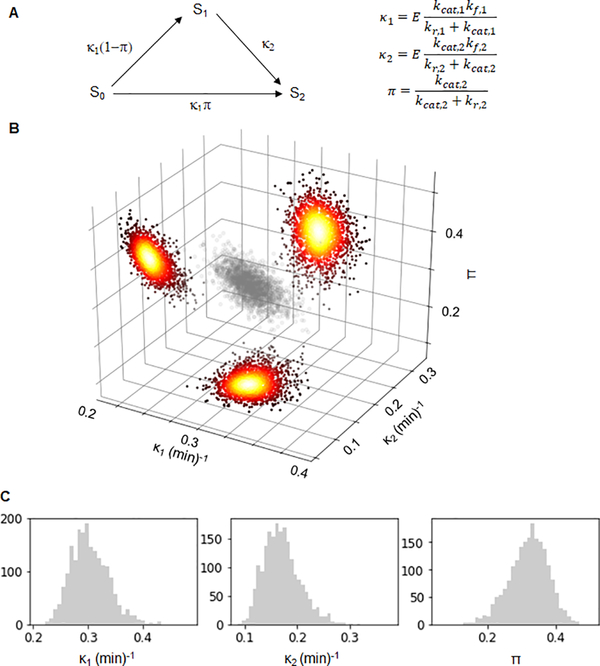
Figure 2. Bayesian analysis of ERK activation by wild type MEK.
A) The reduced three parameter model. The species S0, S1 and S2 correspond to different phosphostates of the substrate. The arrows and their labels denote rates of phosphorylation. The parameters κ1 and κ2 are the kinetic efficiencies of the first and second phosphorylation step, respectively, multiplied by the total amount of enzyme. The parameter π is the probability that both phosphorylations are carried out by the same enzyme. B) A scatter plot of 2000 parameter values sampled from the posterior distribution of Bayesian inference of the parameters corresponding to wild type MEK (grey). Accompanying the plot are heatmaps of the kernel density estimations of the 2D marginal distributions of the respective parameter pairs. C) Histograms of the Bayesian posterior samples for the three parameters (from left to right: κ1 (min)−1, κ2 (min)−1 and π). See also Table S1, Figures S1 and S2.

