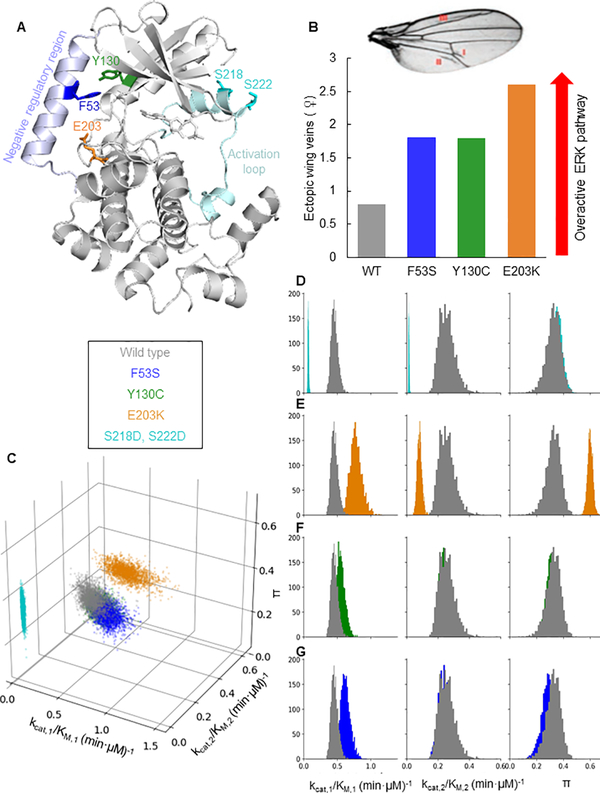
Figure 3. Mutations in MEK can be categorized based on kinetic parameters.
A) Positions of the mutations on MEK1 (PDB 3EQI [39]). The residues F53, Y130, and E203 are located between the interface of the negative regulatory helix and the kinase domain. S218 and S222 are located in the activation loop. B) Illustration of MEK mutant quantification of phenotype severity from previous study [41]. Overactivation of the ERK pathway leads to ectopic veins in fly wings. Shown are the number of ectopic veins in flies expressing the different MEK variants. C) A scatter plot showing parameter values sampled from the posterior distribution of the Bayesian inference for each MEK variant. The catalytic efficiency of the first phosphorylation is plotted on the front horizontal axis, the catalytic efficiency of the second phosphorylation on the right horizontal axis, and the processivity π on the vertical axis. Colors correspond to MEK variants. While the parameter values of the wild type MEK, F53S, and Y130C are indistinguishable, the parameter values for E203K and S218D, S222D are distinct. D-G) Histograms of the Bayesian posterior samples for the three parameters. Each histogram contains values for the parameter indicated by the column label and was obtained using Bayesian inference. Each histogram color corresponds to a MEK variant (cyan for S218D,S222D; orange for E203K; green for Y130C; blue for F53S). The grey histograms correspond to parameters for the wild type MEK. κ1 and κ2 are normalized by enzyme concentration to obtain kcat,1/KM,1 (min·μM)−1 and kcat,2/KM,2 (min·μM)−1. See also Figures S3 and S4.

