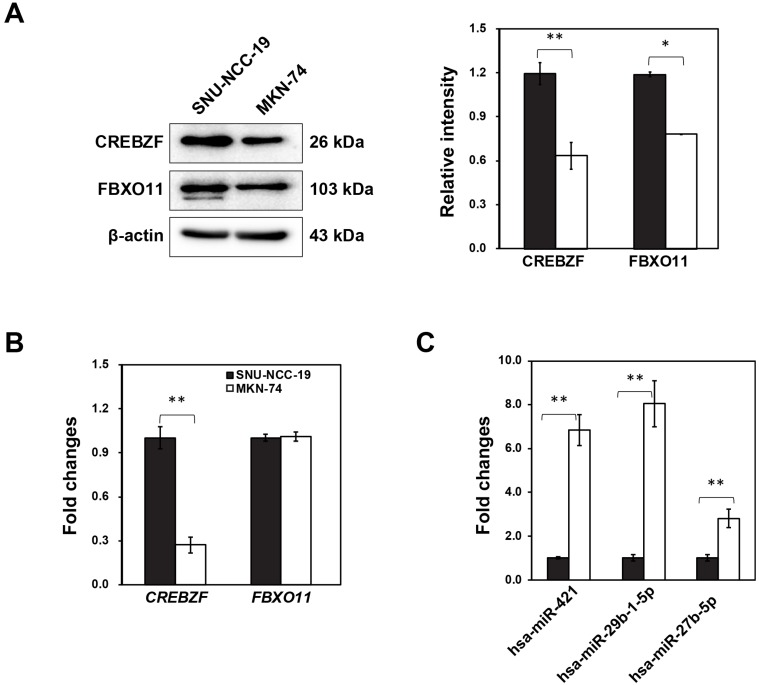
Figure 1.
Differential regulation of potential biomarkers (FBXO11 and CREBZF) and miRNAs (hsa-miR-421, hsa-miR-29b-1-5p, and hsa-miR-27b-5p) in two different gastric adenocarcinoma cell lines (SNU-NCC-19 and MKN-74). (A) qRT-PCR, (B) Western blot analysis, and (C) Expression level of hsa-miR-421, hsa-miR-29b-1-5p, and hsa-miR-27b-5p. All values are representative of three independent experiments with the S.D. indicated by error bars. Significant differences between the normal and the cancer group were determined via ANOVA, with p values indicated as *p<0.05 and **p<0.01.

