
Figure 2.
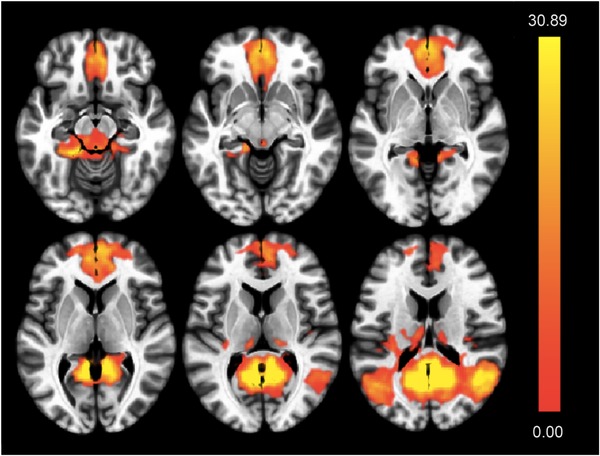
Spatial definition of the default mode network (DMN) based on blood oxygen level–dependent (BOLD) time course synchronicity within independent component 3. Indicated are axial slices indicating brain regions included by component 3. Significance levels of voxel‐level BOLD synchronicity are color coded (T‐map, highest values are yellow)