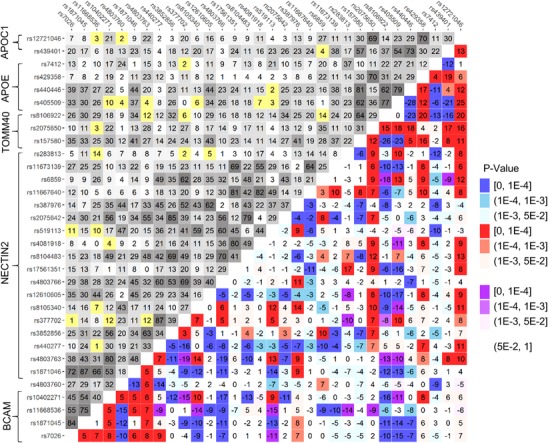
Figure 2.

Molecular signature of Alzheimer's disease (AD). Upper‐left triangle: Linkage disequilibrium (LD) pattern (r, %) in the pooled sample from all studies, non‐cases, for 32 single nucleotide polymorphisms (SNPs). Lower‐right triangle: Heat map for Δr = rcases−rnon‐cases representing the molecular signature of AD. Red denotes rcases > rnon‐cases and blue denotes rcases < rnon‐cases. Purple and yellow show the estimates with opposite signs of rcases and rnon‐cases. For convenience, positive sign of rnon‐cases has been selected. Legend on the right shows color‐coded P‐values. The heat map shows that LD changes for the vast majority of SNPs in the entire region spanning all five genes. Numerical estimates are shown in Table S2
