
Figure 4.
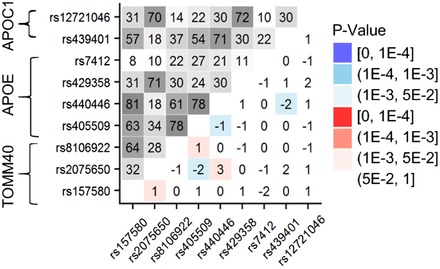
Linkage disequilibrium (LD) patterns in younger and older individuals. Upper‐left triangle: LD pattern (r, %) in younger subjects who were <55 years at biospecimens collection for nine single nucleotide polymorphisms (SNPs) from the TOMM40‐APOE‐APOC1 locus. Lower‐right triangle: Heat map showing Δryo = ryoumg − rold as the difference in LD estimates in younger and older samples. Older sample included subjects with no Alzheimer's disease (AD) who were 55 years and older at biospecimens collection. Numerical estimates are shown in Table S6