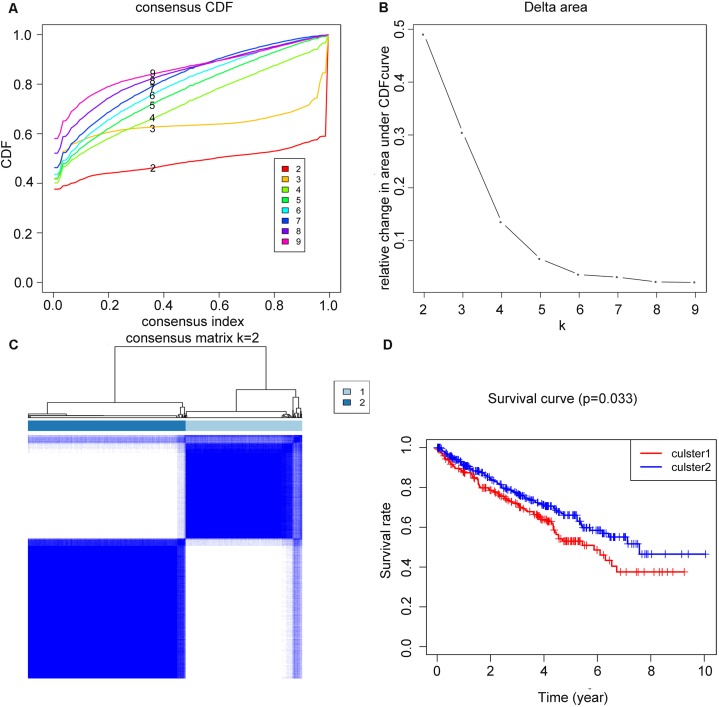
Figure 2. Clustering of TCGA–KIRC patients and overall survival (OS) of the two clusters.
(A) Consensus clustering cumulative distributive function (CDF) for k = 2–9, the lines were labeled in numerical order from the bottom to the top. (B) Relative change in area under CDF curve for k = 2–9. (C) Patients of TCGA–KIRC was divided into two clusters when k = 2. (D) Kaplan–Meier overall survival (OS) curve for ccRCC patients between the two clusters.

