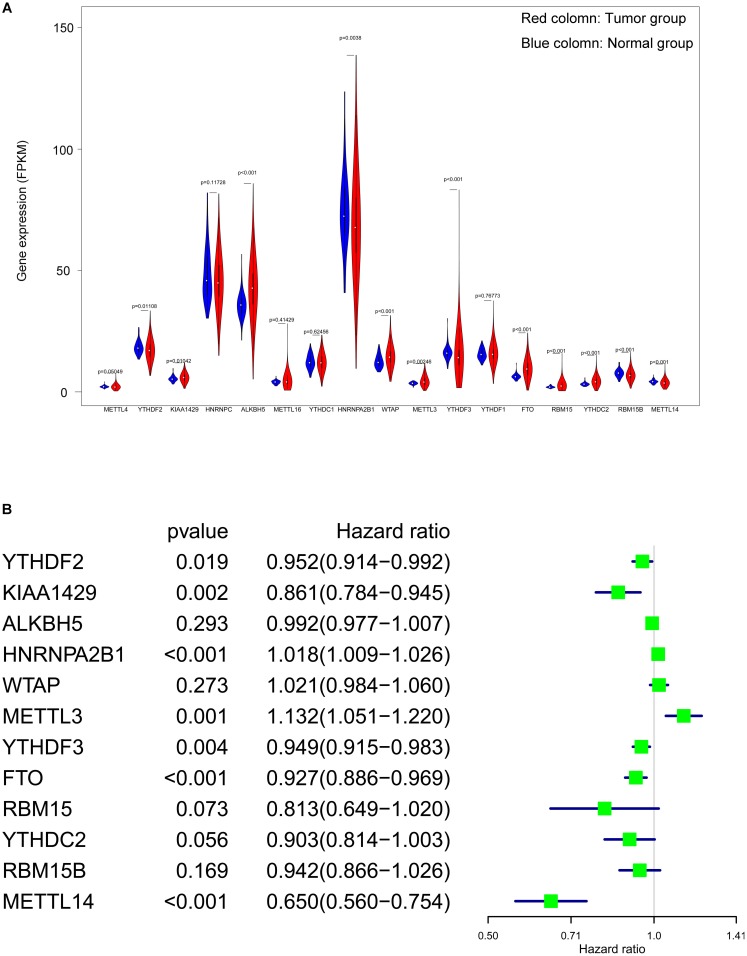
Figure 3. Screening of differentially expressed and prognostic related m6A related genes.
(A) Violin plot of selection of differentially expressed m6A related genes (p < 0.05), the tumor and normal samples were represented as red and blue group respectively. (B) Identification of m6A related genes that has correlation with the OS.

