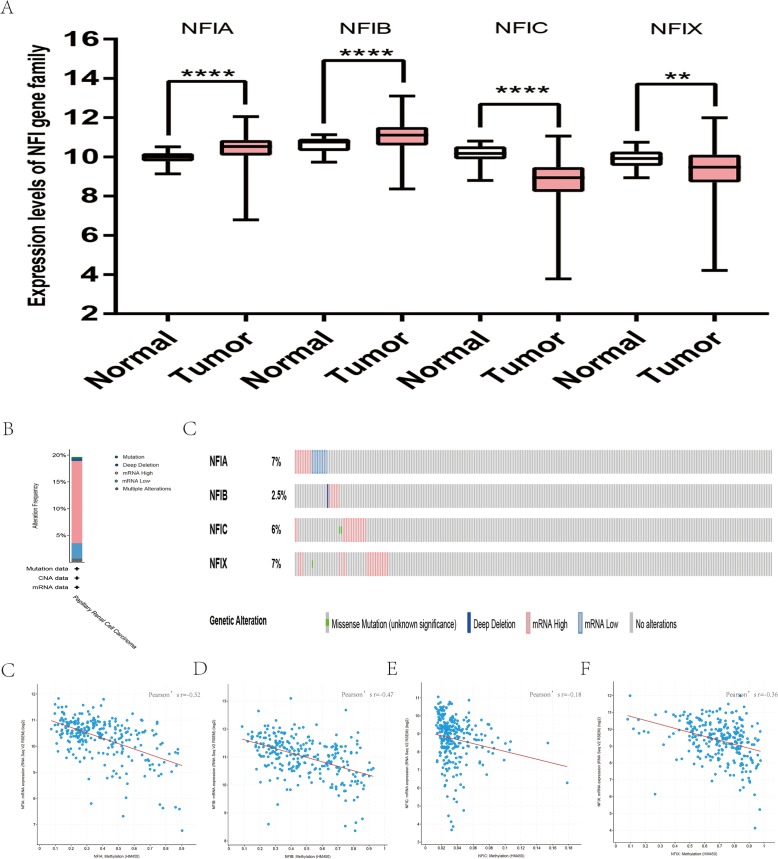
Figure 9. Transcription levels, genomic analysis of the NFIs and regression analysis between the mRNA expression of the NFIs and its corresponding methylation in kidney renal papillary cell carcinoma (A–G).
Box-whisker plots show the differences in transcript levels of the NFI family members between normal and tumors samples. The median value is represented by the middle line in the boxes. Statistical differences were examined by two-tailed student’s t-test. **p < 0.01, ****p < 0.0001. NFI, Nuclear factor I; TCGA, The Cancer Genome Atlas.

