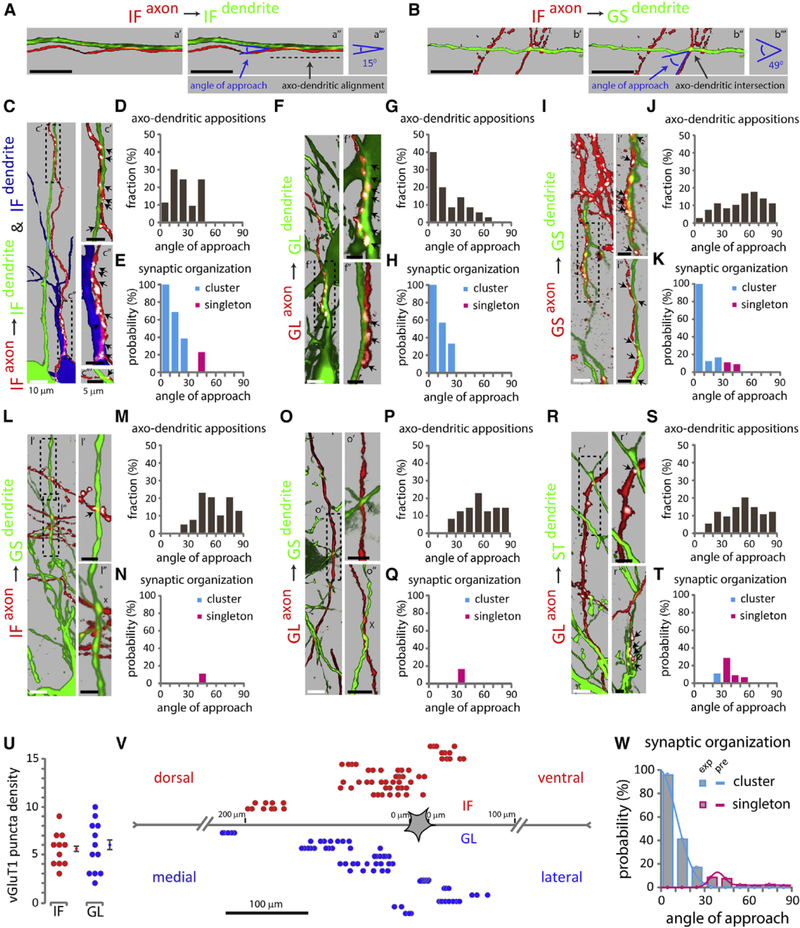
Figure 4. The Angle of Axo-dendritic Approach and Synaptic Organization in Defined Reflex Circuits.
Distribution of cluster and singleton synapses as a function of the angle of axo-dendritic approach. (A and B) Single confocal optical sections between IF axon on IF dendrite (a′), and IF axon on GS dendrite (b′). Green, motor neuron dendrite; red, sensory axon. Blue arrows point to angle of approach between IF axon on IF dendrite (a″), and IF axon on GS dendrite (b″). Dark gray arrows point to axo-dendritic alignment (shown with a dashed line) in (a″), and axo-dendritic intersection in (b″). (a″′ and b″′) indicate measured angle of approach between IF axon on IF dendrite (a″′), and IF axon on GS dendrite (b″′).
(C, F, I, L, O, and R) Maximum projection images of pseudo-color reconstructions of confocal optical sections. Green or blue, motor neuron; red, sensory axons; white, vGluT1+ puncta on sensory axons. Arrows indicate sensory axon + vGluT1+ + motor neuron appositions, x indicates absence of synapses from identified axo-dendritic appositions. 0 indicates lack of contact between sensory axon + vGlut1+ punctum and GFP+ dendrite, upon image rotation. (C) IF sensory axon on IF motor neuron dendrites; (c′ and c″) synaptic clusters; (c″′) singleton; (c″′) from a different section. (F) GL axon on GL dendrites; (f and f″) synaptic clusters; (f″) from a different section. (I) GS axon on GS dendrites; (¡′ and i″) synaptic clusters; (i″) from a different section. (L) IF axon on GS dendrites; (I′) singleton; (I″) no synaptic contact. (O) GL axon on GS dendrites; (o′ and o″) no synaptic contacts; (o″) from a different section. (R) GL axon on ST dendrites; (r′) singleton; (r″) cluster and lack of contact between sensory axon + vGlut1+ punctum and GFP+ dendrite; (r”) from a different section.
(D, G, J, M, P, and S) Histograms indicate the fraction (y axis) of angle (degrees) of approach (x axis) for different axo-dendritic appositions. IF axon on IF dendrite (D), GL axon on GL dendrite (G), GS axon on GS dendrite (J), IF axon on GS dendrite (M), GL axon on GS dendrite (P), and GL axon on ST dendrite (S).
(E, H, K, N, Q, and T) Histograms indicate the probability (y axis) of vGluT 1+ cluster (cyan) or singleton (magenta) as a function of the angle (degrees) of approach (x axis). IF axon on IF dendrite (E), GL axon on GL dendrite (H), GS axon on GS dendrite (K), IF axon on GS dendrite (N), GL axon on GS dendrite (Q), and GL axon on ST dendrite (T).
(U) Scatterplot of synaptic cluster size estimated from the number of consecutive vGluT1+ puncta within a pseudo-color reconstructed sensory axon opposed to a homonymous motor neuron. Error bars represent SEM.
(V) Spatial distribution of homonymous clusters, denoted by individual rows. Each circle represents a sensory axon + vGluT1+ + motor neuron apposition. Red circles, homonymous IF inputs; blue circles, homonymous GL inputs.
(W) Histograms (experimental data) and curves (predictions) depict the probability of cluster versus singleton synapse formation as a function of the angle (degrees) of axo-dendritic approach.
Values represent a pooled distribution of GL sensory with GL, ST, TA, GS, and IF motor neurons, GS sensory with GS motor neurons, and IF sensory with GL, ST, GS, and IF motor neurons (see also Table S1). Black dotted boxes in (C), (F), (I), (L), (O), and (R) depict angle of approach and synaptic organization fordistinct axo dendritic appositions. Black scale bar in (A) and (B), 10 n.m. See Table S2 for experimental sample sizes.

