
Figure 5. Positional Factors Can Account for S-M Connectivity Patterns in the GL and IF Reflex Circuits.
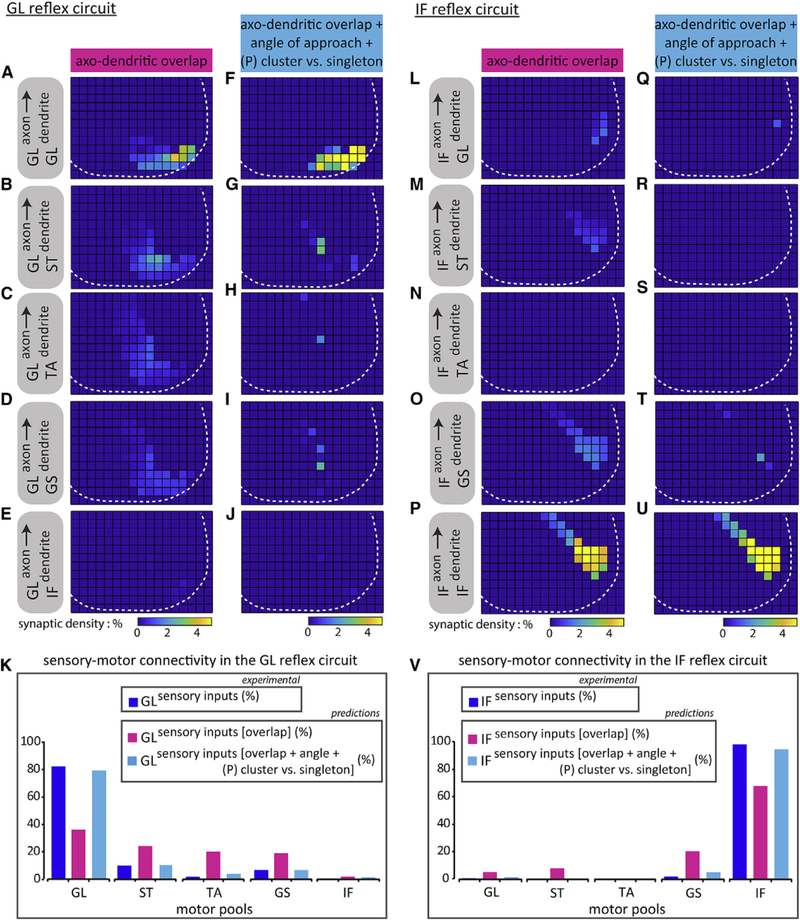
(A-E and L-P) Predicted patterns of connectivity based on axo-dendritic overlap between GL sensory axons on (A) GL, (B) ST, (C) TA, (D) GS, and (E) IF motor neurons, and IF sensory axons on (L) GL, (M) ST, (N) TA, (O) GS, and (P) IF motor neurons.
(F-J and Q-U) Same as (AHE) and (LHP), respectively, except with the addition of angular preference factors. GL sensory axons on (F) GL, (G) ST, (H) TA, (I) GS, and (J) IF motor neurons, and IF sensory axons on (Q) GL, (R) ST, (S) TA, (T) GS, and (U) IF motor neurons. White dotted line depicts gray matter boundary. Histograms summarizing (K) GL, or(V) IF sensory connectivity patterns across distinct motor pools. Sensory inputs histograms (blue) were derived from CT-B+ + vGluT1+ experimental data, as previously shown in Figure 3. Sensory inputs [overlap] histograms (magenta) are synaptic distributions (%) predicted using binned axo-dendritic membrane overlap data (K: GL on GL: 36, GL on ST: 24, GL on TA: 20, GL on GS: 18.5, GL on IF: 1.5; V: IF on GL: 5, IF on ST: 7.5, IF on TA: N/A, IF on GS: 20, IF on IF: 67.5). Sensory inputs [overlap + angle + (P) cluster versus singleton] histograms (cyan) are synaptic distributions (%) predicted incorporating binned axo-dendritic membrane overlap data and angular preference factors (K: GL on GL: 79, GL on ST: 10, GL on TA: 3.5, GL on GS: 6.5, GL on IF: 1; V: IF on GL: 1, IF on ST: 0, IF on TA: N/A, IF on GS: 4.5, IF on IF: 94.5). N/A, not applicable. See Table S2 for experimental sample sizes.