Figure 2.
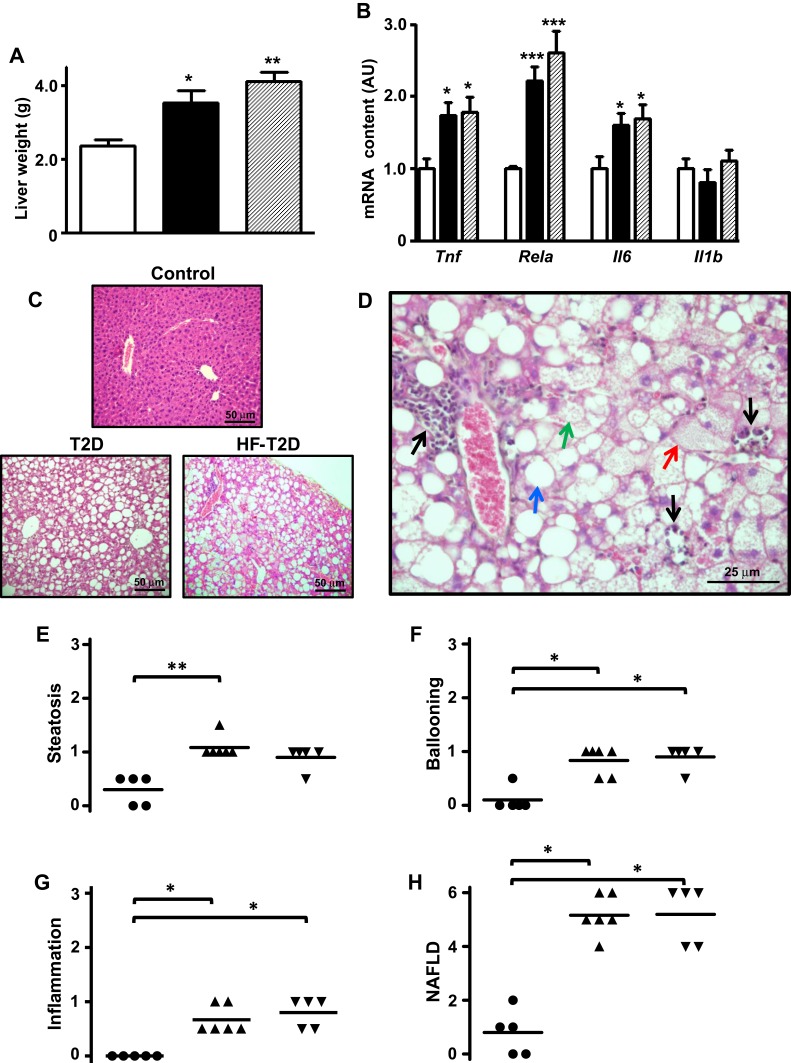
Type 2 diabetes (T2D) induces severe NAFLD. Liver from control (C, white bars, circles), type 2 diabetic (T2D, black bars, up triangles) and high-fat-fed T2D (HF-T2D, dashed bars, down triangles) mice were analyzed. (A), liver weight; (B) mRNA expression of inflammatory markers Tnf, Rela, Il6 and Il1b; (C) hematoxylin-eosin stained liver tissue revealing evident steatosis in T2 mice (20X magnification); (D) increased magnification (40X) of hematoxylin-eosin stained liver tissue from T2D mice revealing the presence of micro-steatosis (green arrow), macro-steatosis (red arrow), ballooning (blue arrow) and inflammatory foci (black arrows); (E-G) steatosis, ballooning and inflammation grade; (H) NAFLD score. Data are expressed as mean ± SEM of 10 to 16 (A) or 6 to 8 animals (B). In (E–H), data are the means and the individual values of 5 animals. The means were analyzed by one-way ANOVA followed by the Newman-Keuls post-test (A, B) or Kruskal–Wallis followed by the Dun post-test (E–H). *P<0.05, **P<0.01 and ***P<0.001 vs (C).

