Fig, 1.

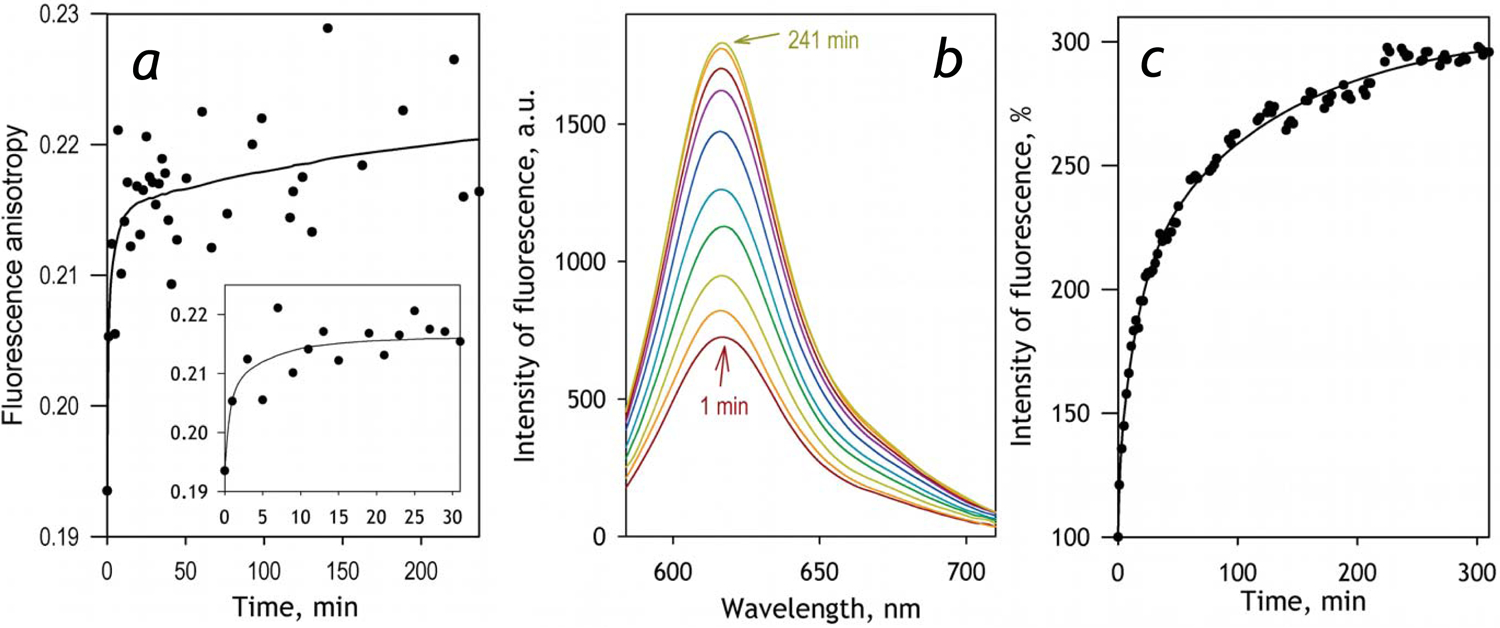
Effect of incorporation of CYP2E1-BODIPY into liposomes on the anisotropy and intensity of BODIPY fluorescence. The data shown in the figure were obtained during the incubation of 0.2 μM CYP2E1-BODIPY(1:1) with liposomes added to the concentration of 600 μM (per phospholipid). Panel a illustrates the changes in the anisotropy of fluorescence during the incubation. The solid line shown in the panel represents the approximation of the dataset with a three-exponential equation. The rate constants of the three phases found in this approximation are equal to of 1.1, 0.06 and 0.008 min−1 and the relative amplitudes amount to 66, 6 and 18% respectively. The inset zooms in the initial phase of the kinetics. Panel b exemplifies a series of spectra of fluorescence recorded during the incubation with a coplanar orientation of polarizers. The spectra shown here were recorded at 1, 3, 7, 15, 31, 61, 111, 191 and 241 min after addition of liposomes to CYP2E1-BODIPY. Panel c shows the changes in the relative intensity of fluorescence during the incubation. The solid line represents the approximation of the dataset with a sum of three exponential terms having the same rate constants as those specified for the kinetics shown in the panel a, and having the relative amplitudes of 12, 38, and 50% for the fast, mediun and the slow phases respectively.
