
Fig. 2.
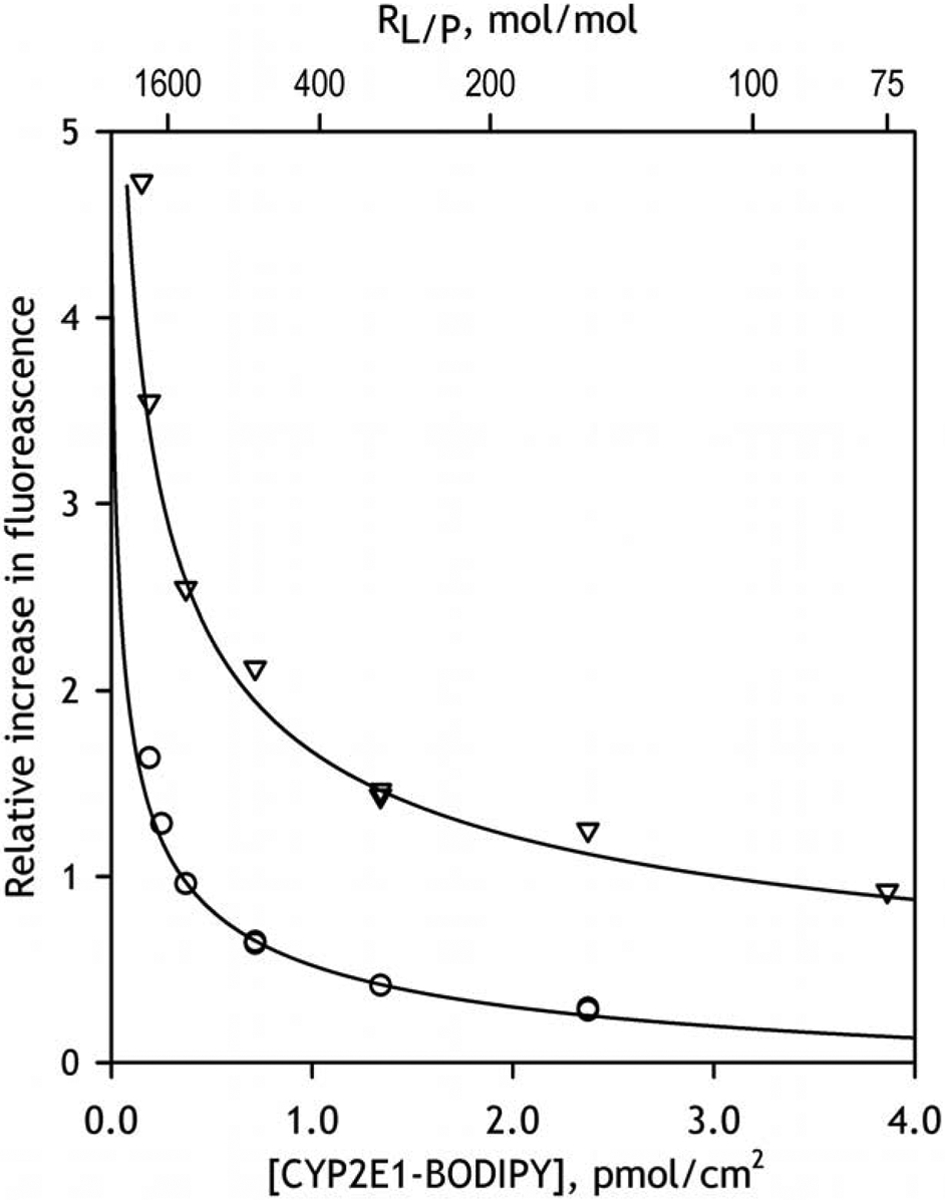
The dependencies of the relative increase in fluorescence intensity caused by incorporation of CYP2E1-BODIPY into the membranes of liposomes. The dataset shown in circles was obtained with CYP2E1-BODIPY(1:1), while the one shown in triangles represents the results obtained with μM CYP2E1-BODIPY(1:2). Solid lines show the approximations of the data sets with Eq. 3.