
Fig. 9,
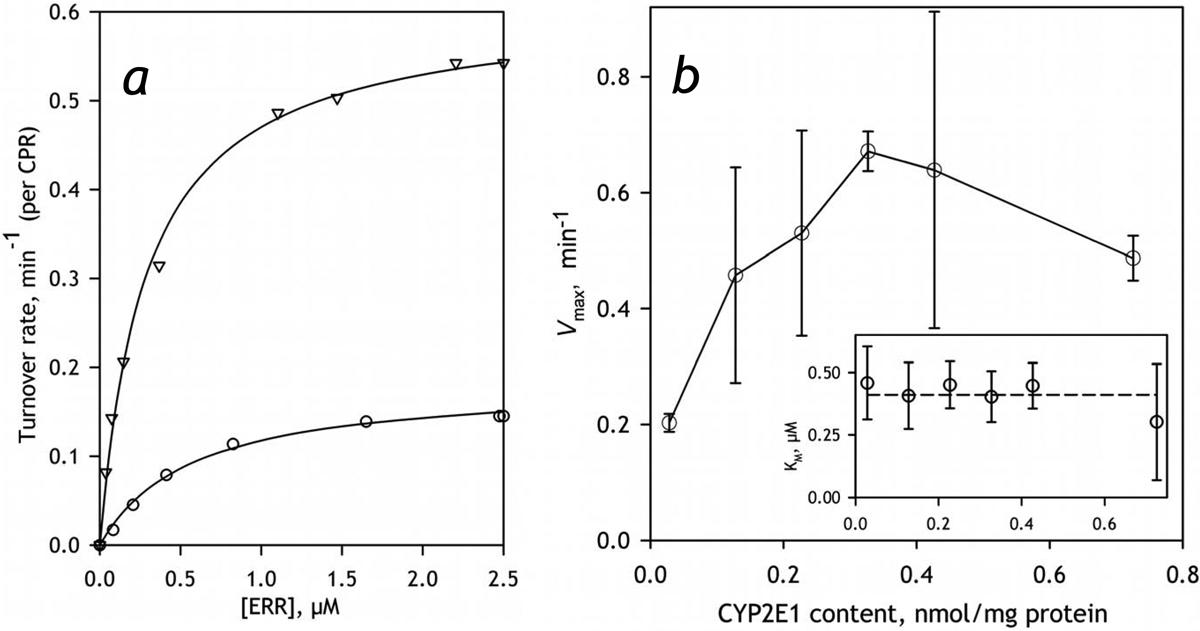
The effect of incorporation of CYP2E1 into HLM-2 on the parameters of metabolism of ERR. Panel a exemplified the dependence of the rate of the turnover on substrate concentration obtained with intact HLM (circles) and the sample containing CYP2E1 incorporated in the amount of 0.3 nmol per mg protein that corresponds to 0.75:1 ratio to the microsomal P450 content (triangles). These traces represent the averages of 3 and 2 individual experiments respectively. Panel b shows the dependencies of Vmax (main panel) and KM on CYP2E1 content. Error bars represent the confidence intervals calculated for p=0.05 on the basis of 2–5 measurements.