
Fig. 4. Ligands eluted from hpMR1+EC and hpMR1+MS contain both shared and unique ions.
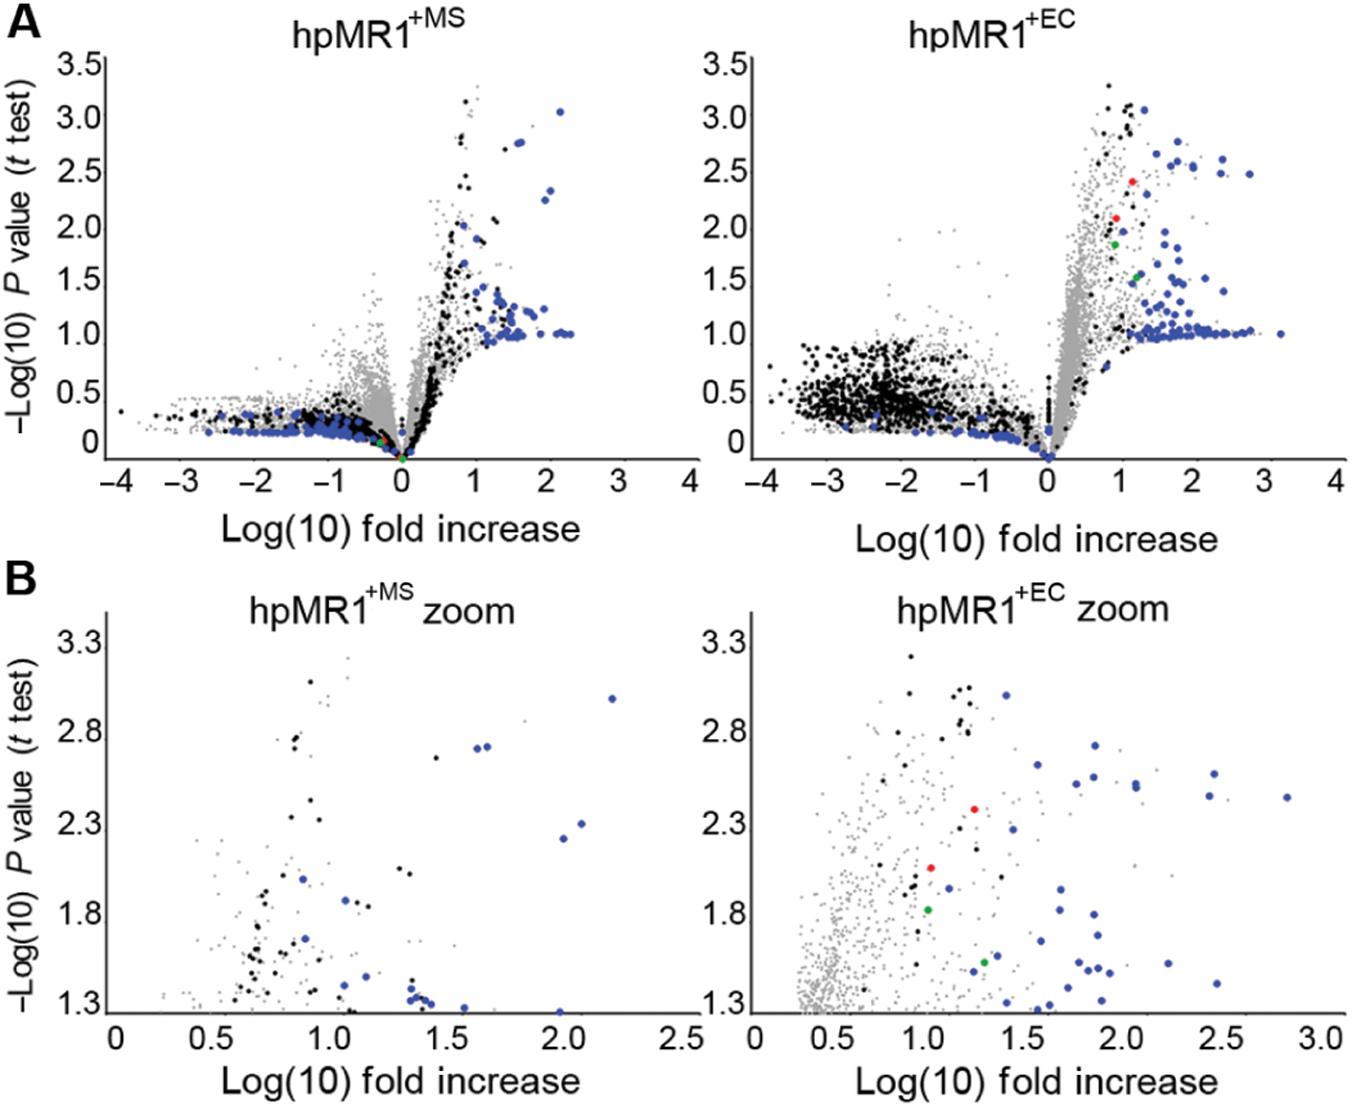
Intensities from all observed MS1 ions in triplicate injections of hpMR1+MS, hpMR1+EC, hpMR1−bac, and T22 were determined using extracted ion AUC analysis. For all ions, average intensities in hpMR1+MS (left) and hpMR1+EC (right) ions were compared with the combined average intensity of all other samples and are plotted as the log(10) of the fold increase. P values were obtained with a t test and plotted as the inverse log(10). (A) Plot of all ions for hpMR1+MS (left) and hpMR1+EC (right). (B) Only significantly (P ≤ 0.05, −log P = 1.3) increased ions for either hpMR1+MS (left) or hpMR1+EC (right). Red and green dots, previously identified MR1T ligands; blue dots, hpMR1+EC or hpMR1+MS unique ligands; black dots, hpMR1 ligands; gray dots, all other ligands. Results are representative of three independent experiments.