
Fig. 5. GNPS assists in the identification of novel hpMR1 eluted ions.
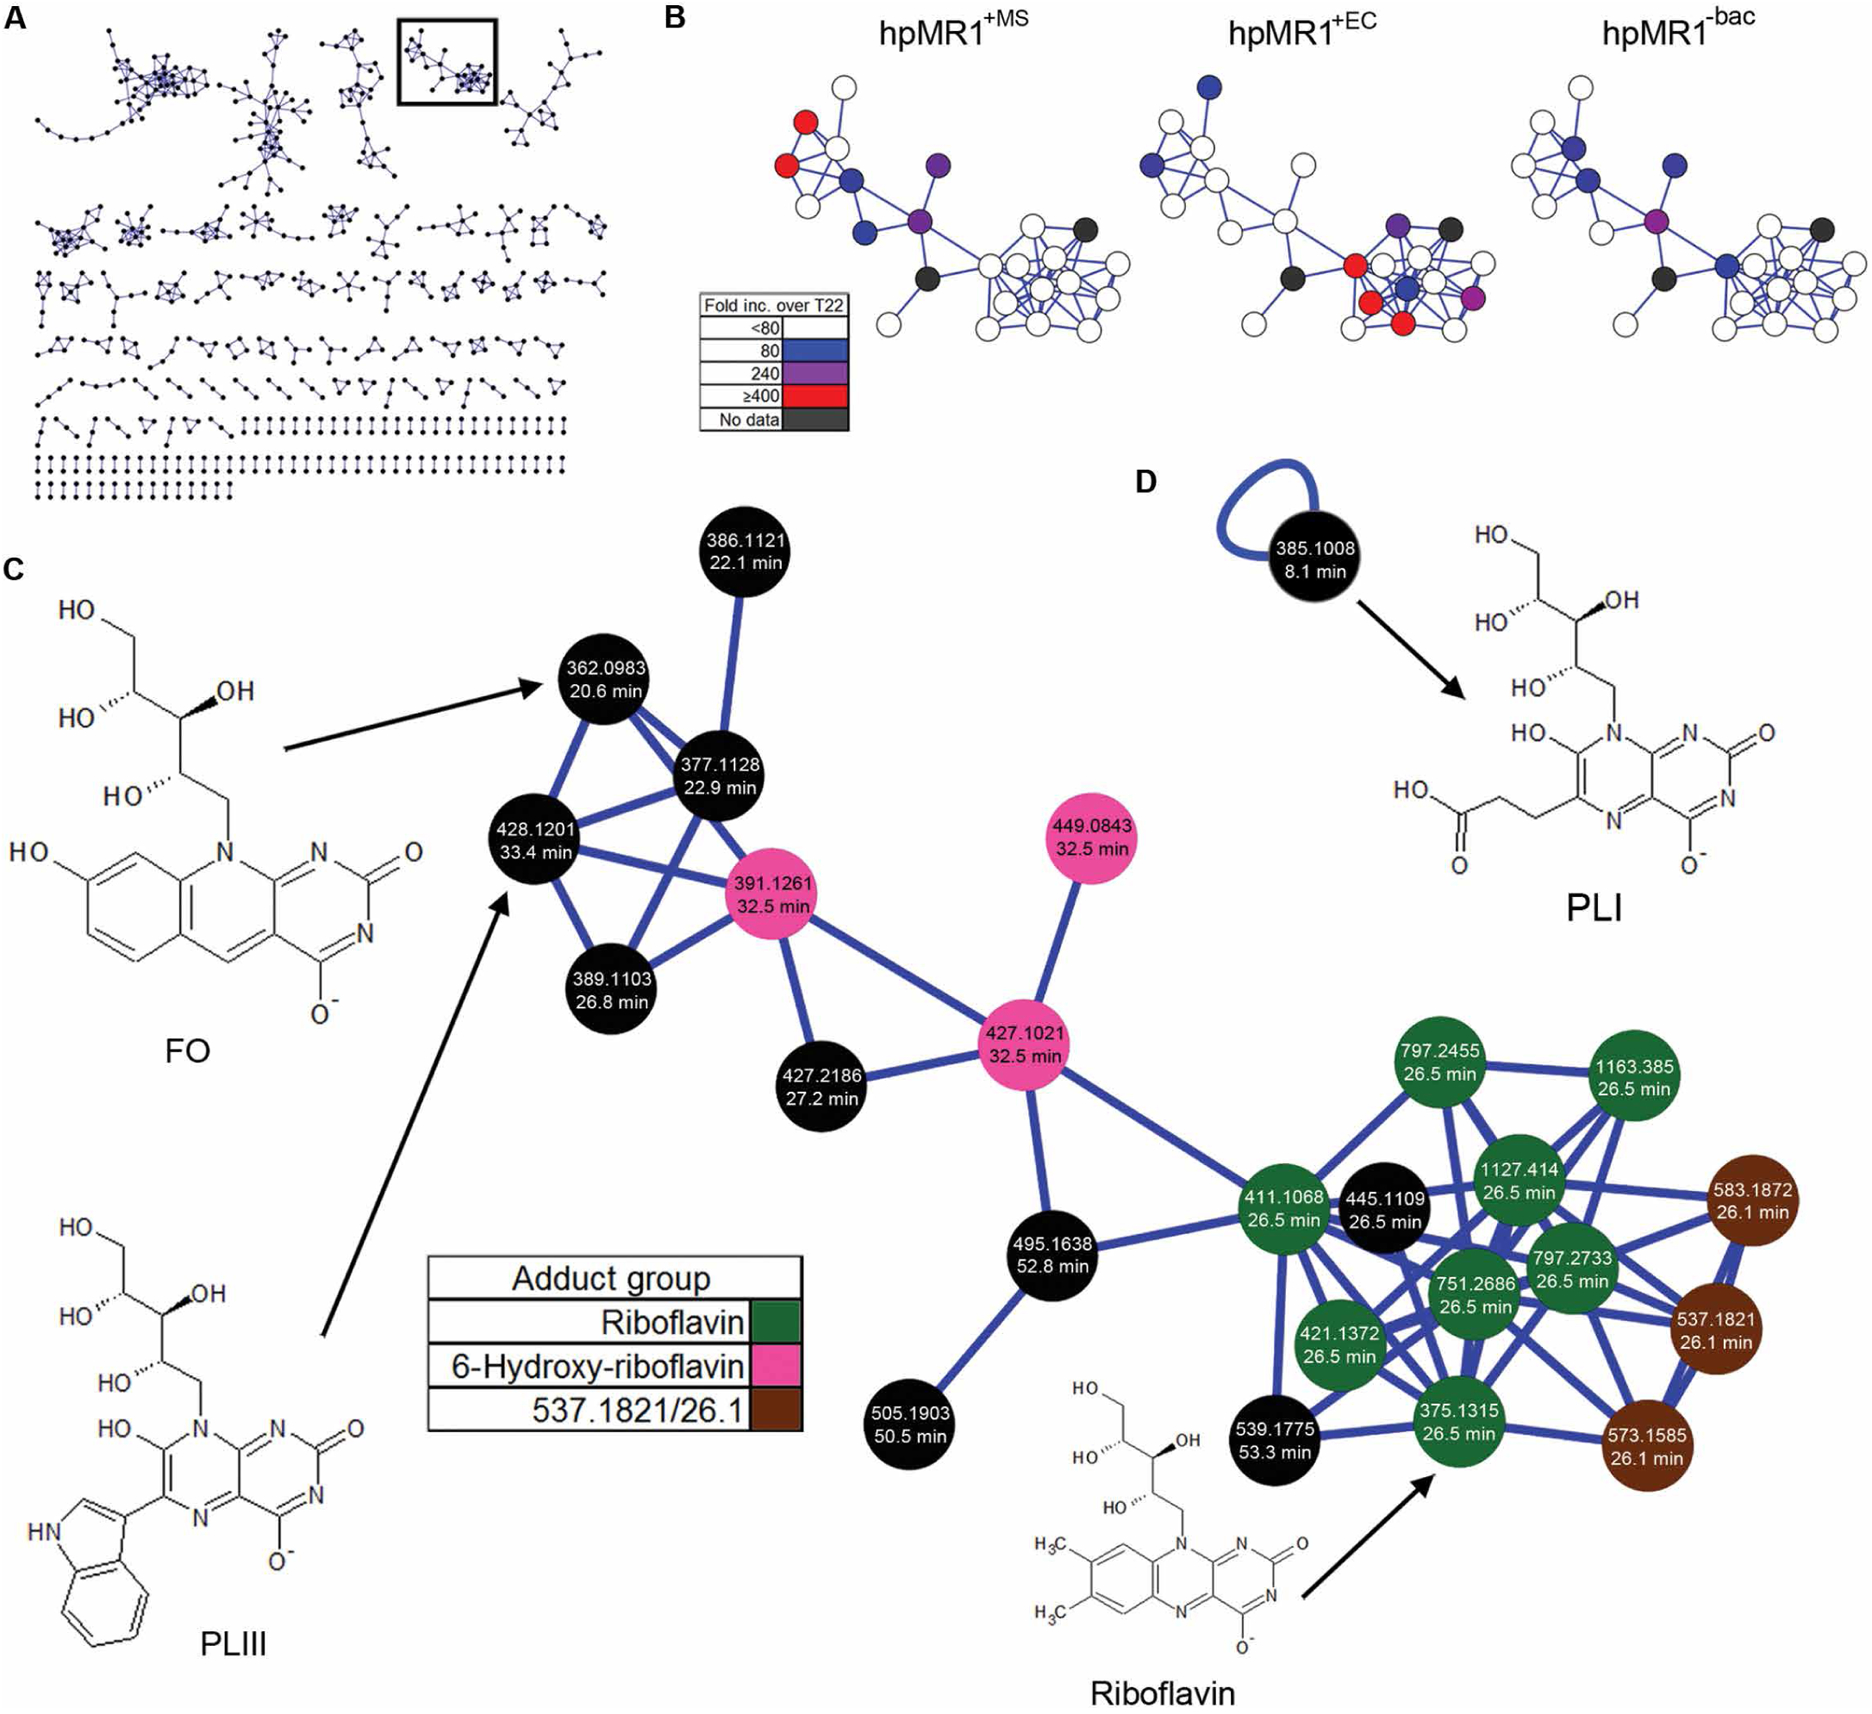
(A) Molecular network of ions eluted from hpMR1 in a force-directed layout showing clusters ≥2 nodes. Each black node represents an ion MS2 fragment spectra connected by a blue edge based on spectral similarity. The black outline denotes the riboflavin cluster in (B) and (C). (B) Relative abundance of ions in the riboflavin cluster for hpMR1+MS (left), hpMR1+EC (middle), and hpMR1−bac (right). Color indicates the fold increase over T22 in each respective hpMR1 sample. (C) Detailed image of the riboflavin network. The average ion m/z and normalized average retention time for each ion are indicated. Green nodes, riboflavin adducts; pink nodes, adducts of ion 391.1261/32.5; brown nodes, adducts of ion 537.1821/26.1. (D) Single nonclustering node associated with PLI (385.1008/8.1).