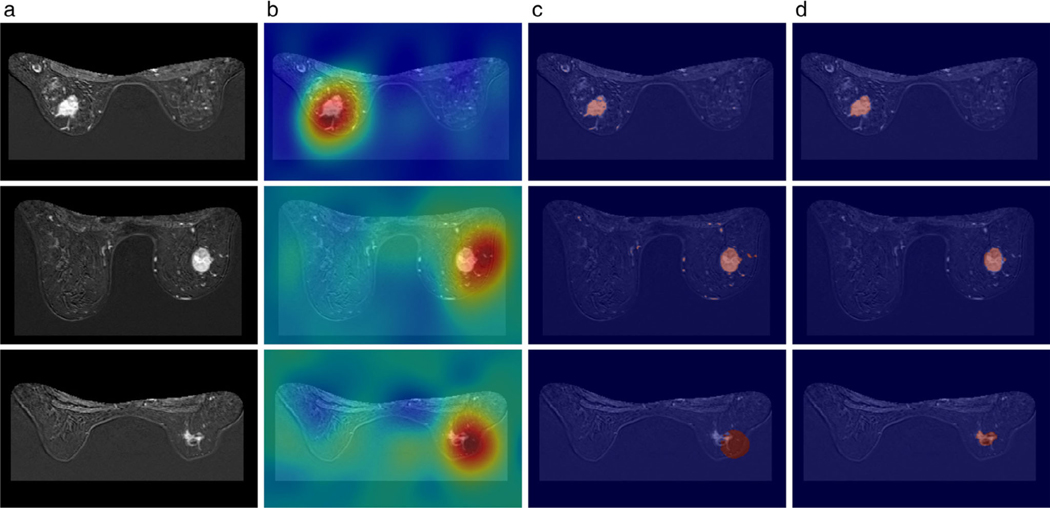
FIGURE 5:
Visualization of (a) the MRI slices from three different samples, (b) the corresponding heatmap obtained from the GMP model, (c) the corresponding refined weak label using DenseCRF, and (d) the manual annotation. Fired color indicates higher values for the activations in (b). Red color indicates the annotation by model and human in (c,d). The Dice coefficients of each sample were: 0.823, 0.683, and 0.091, respectively. (Reprinted and adapted with permission from Zhou et al. J Magn Reson Imaging 2019.)

