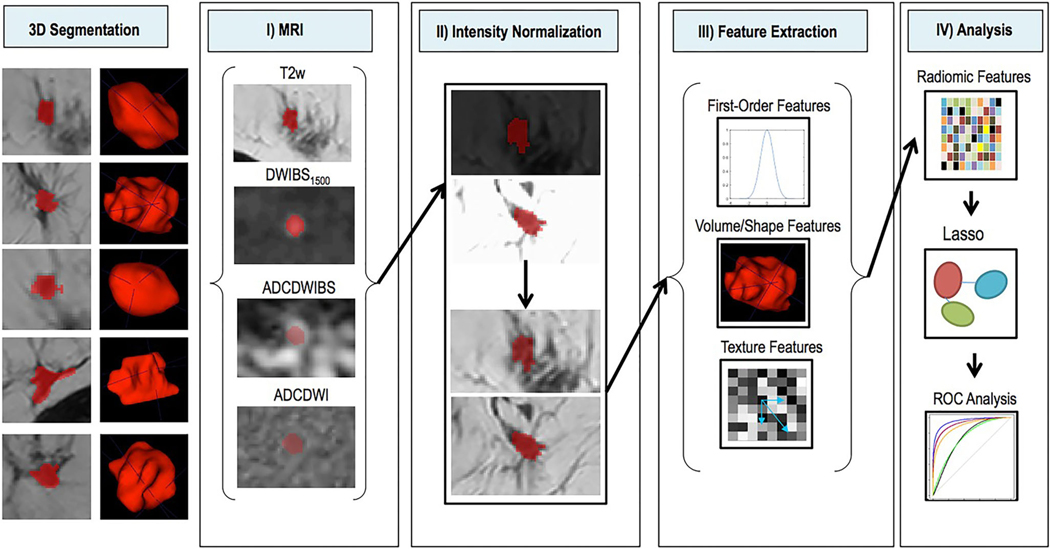
FIGURE 6:
Schematic depiction of image processing. Left: 3D segmentations of lesions shown on single T2w slices (left) and as surface shaded 3D renderings (right). I: Segmentations (red) are shown overlaid on the four imaging sequences (T2w, DWIBS1500, ADCDWIBS, and ADCDWI). II: Intensity normalization transforms variable MR signal intensities on T2w and DWI images (top) into comparable image intensities (bottom). III: Radiomic feature extraction uses first-order statistics, volumetric and texture features as defined in Data Supplement S1 to generate a multidimensional imaging signature. IV: The radiomic feature matrix and corresponding outcome data (histopathological results) are combined and used for supervised training of the Lasso regularized logistic regression model. Performance of the constructed model is compared to the performance of known standard parameters using ROC analysis. T2w = T2-weighted; DWI = diffusion-weighted imaging; DWIBS = diffusion-weighted imaging with background suppression (DWIBS); ADC = apparent diffusion coefficient: ROC = receiver operating characteristics. (Reprinted and adapted with permission from Bickelhaupt et al. J Magn Reson Imaging 2017;46:604–616.)

