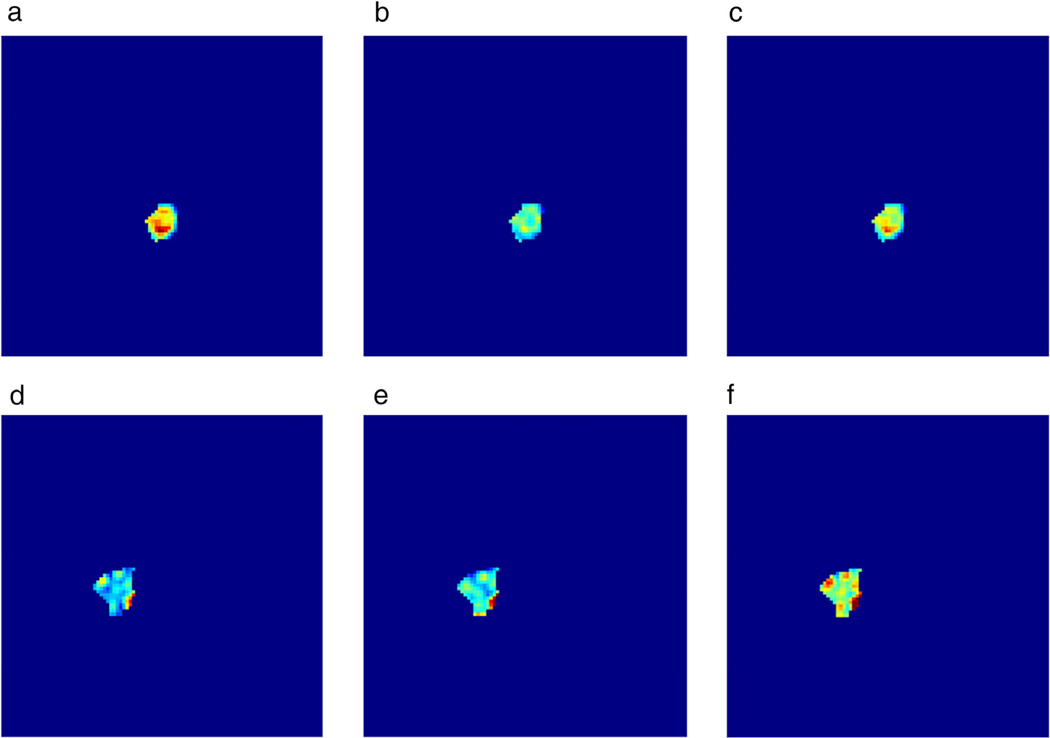
FIGURE 7:
Initial enhancement (a,d), overall enhancement (b,e), and area under the enhancement curve (c,f) maps for a benign papilloma (a–c) and a malignant invasive ductal carcinoma (d–f). It is evident that spatially heterogeneous enhancement is present, which can thus be quantified using texture analysis. (Reprinted and adapted with permission from Gibbs et al. J Magn Reson Imaging 2019.)

