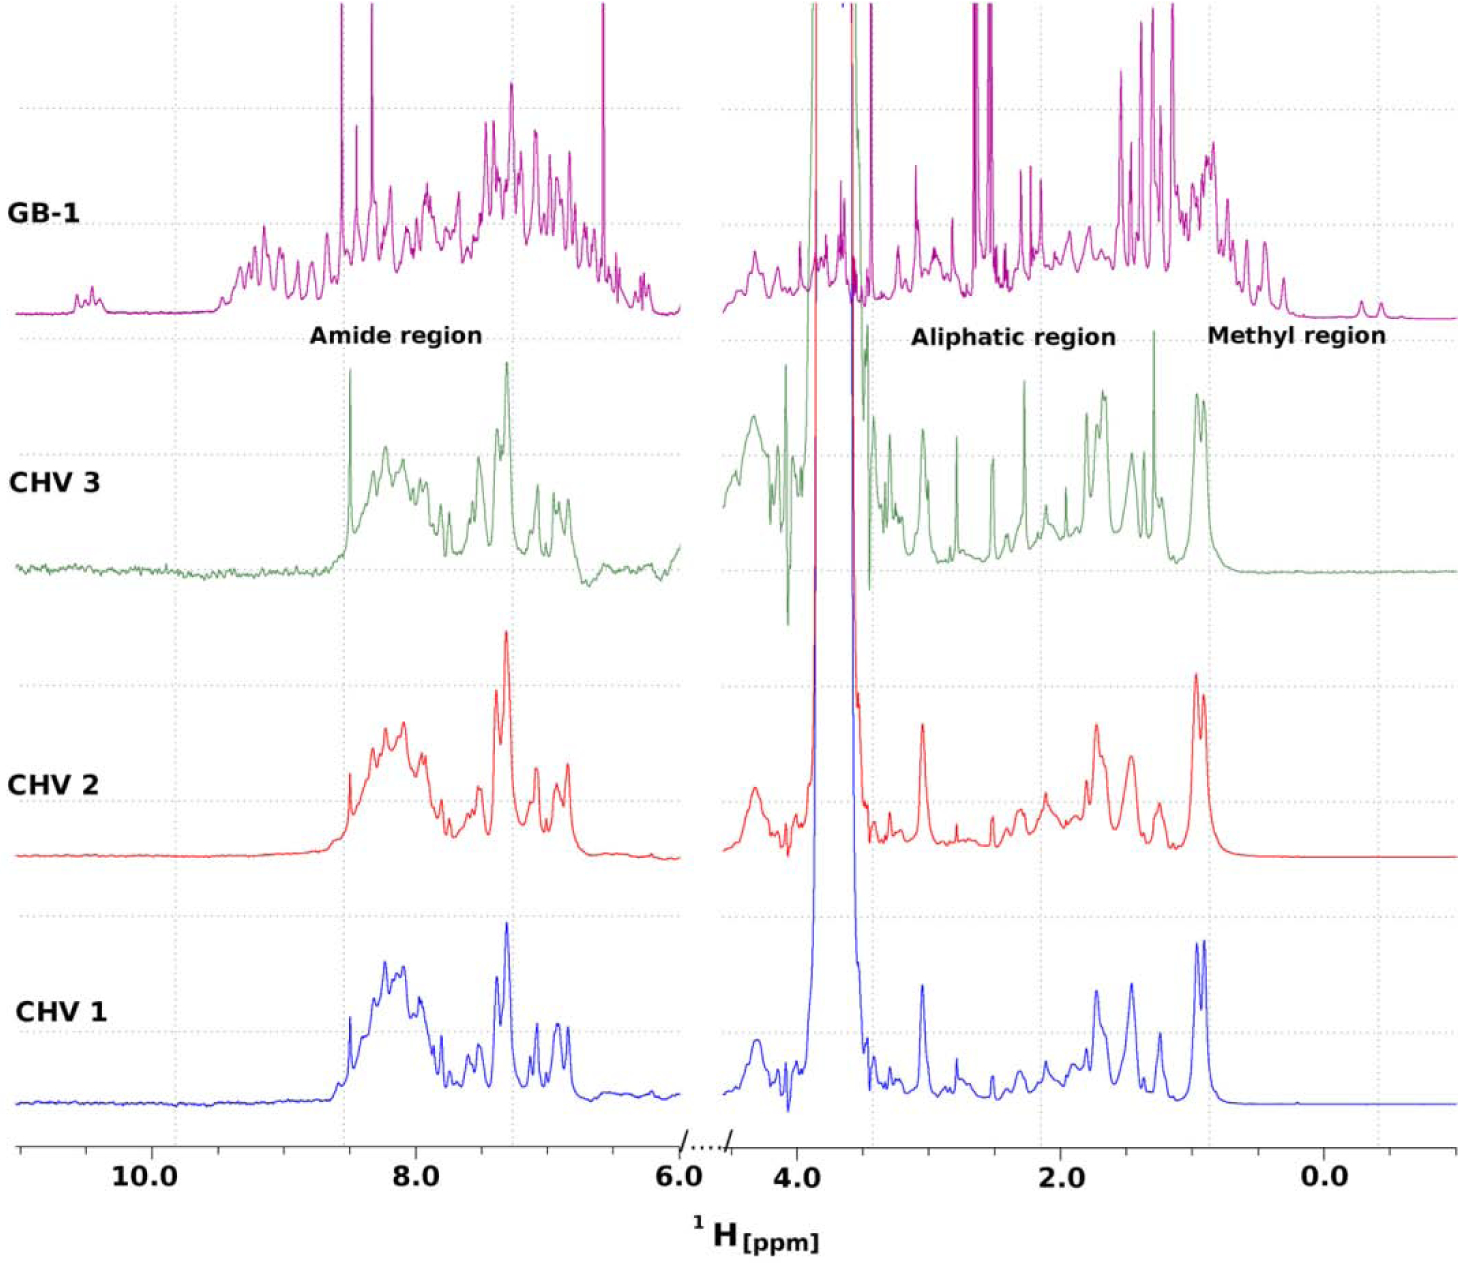
Figure 2. Nuclear magnetic resonance analyses of the Chv proteins.

One-dimensional1H NMR spectra of Chv1, Chv2, and Chv3 and of the β1 immunoglobulin binding domain of protein G (GB1) are shown. The peak intensities of all spectra have been matched to each other and the strong peak near 3.5 ppm observed in the three Chv spectra is a result of 35mM Tris buffer. Methods were as detailed in the text.
