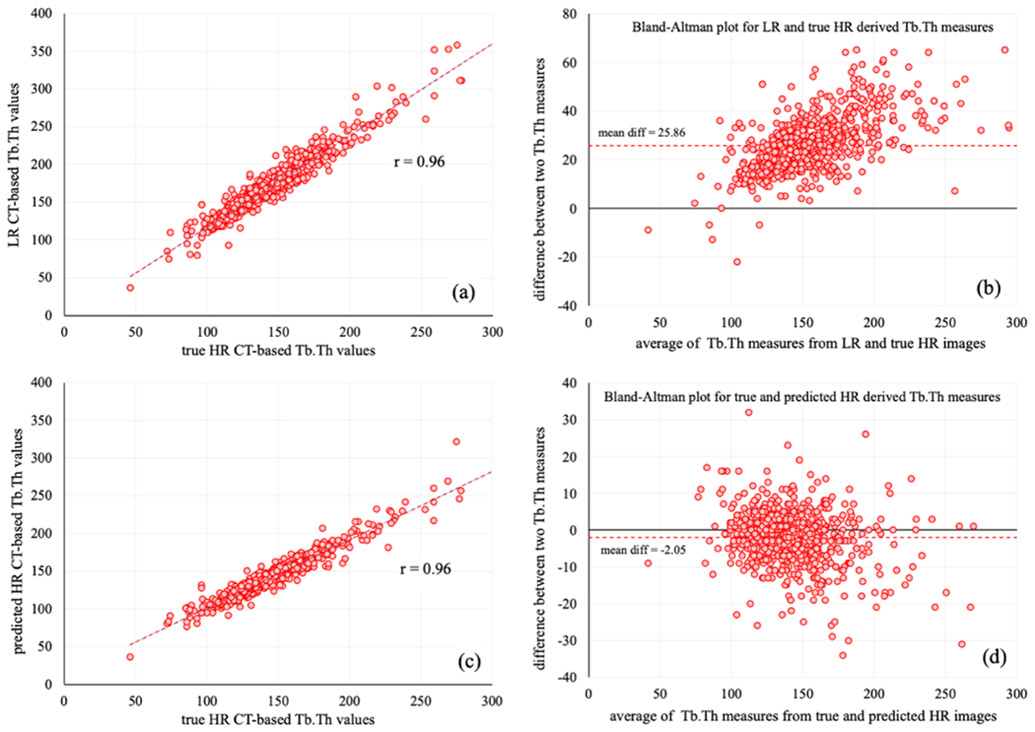
Figure 5.

Linear correlation and Bland-Altman plots of Tb.Th measures from LR, HR, and predicted HR images of nine test subjects. (a) Linear correlation analysis among Tb.Th values from LR and true HR images. (b) Bland-Altman plot of measure difference between LR and true HR images. (c,d) Same as (a,b) but for true HR and predicted HR images.
