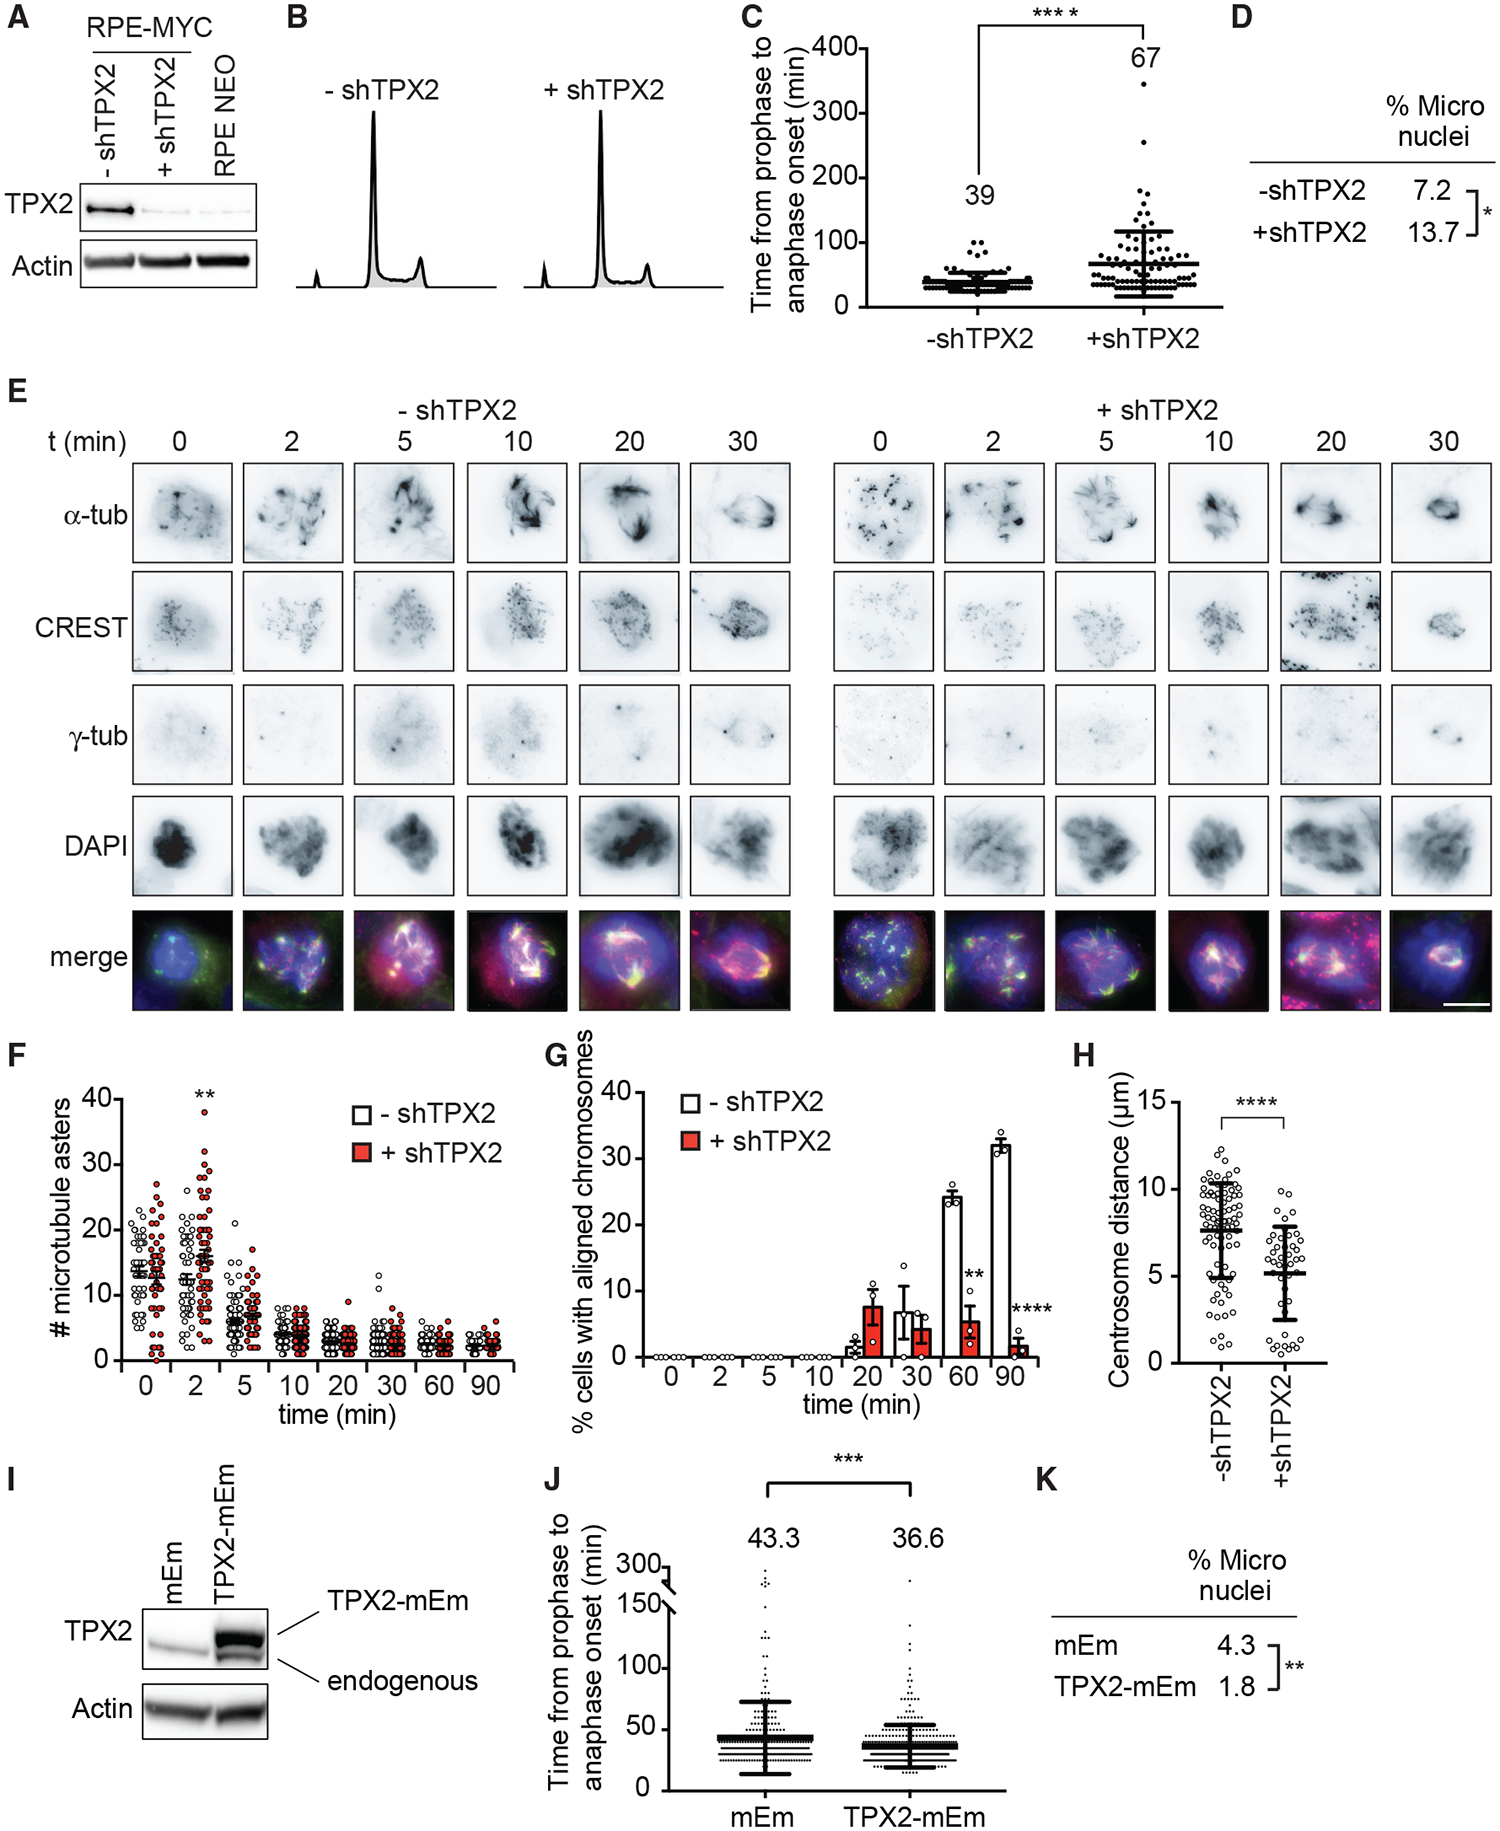
Figure 7. TPX2 Overexpression Is Necessary for MYC-High Cells to Progress through Mitosis.

(A–H) RPE-MYC cells expressing doxycycline-inducible shRNA against TPX2 in the absence (−shTPX2) and presence (+shTPX2) of doxycycline for 4 days.
(A) Western blot analysis of TPX2.
(B) Cell-cycle profiles.
(C) Time from nuclear envelope breakdown to anaphase onset quantified from time-lapse microscopy experiments. Mean ± SD. t test, n = 164 and 164, 3 independent experiments.
(D) Percentage of micronucleated cells. Fisher’s exact test, n = 223 and 182, 3 independent experiments.
(E–H) Nocodazole wash-out assay.
(E) Representative images. Scale bar, 10 μm.
(F) Number of microtubule asters. Mean ± SEM. Unpaired t test, n = 45–117, 3 independent experiments.
(G) Percentage of cells with aligned chromosomes. Mean ± SEM. Fisher’s exact test, n = 45–117, 3 independent experiments.
(H) Centrosome distance 90 min after washout. Mean ± SEM. Unpaired t test, n = 20–84, 3 independent experiments.
(I–K) RPE-MYC cells expressing TPX2-mEmerald (TPX2mEm) or empty vector (mEm).
(I) Western blot of TPX2. Exogenous TPX2-mEm is shifted upward.
(J) Time from nuclear envelope breakdown to anaphase onset from time-lapse microscopy experiments. Mean ± SD. t test, n = 307 and 383, 3 independent experiments.
(K) Percentage of micronucleated cells. Fisher’s exact test, n = 1,579 and 2,008, 3 independent experiments.
*p < 0.05, **p < 0.01, ***p < 0.001, ****p < 0.0001.
