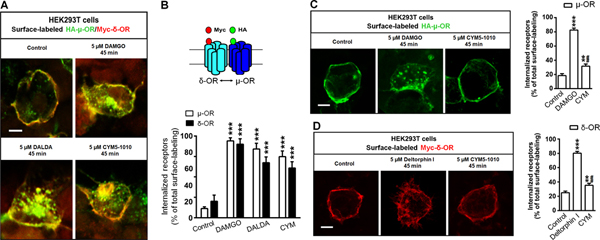
Figure 5. Activation of μ-OR leads to co-internalization of surface δ-OR.

(A) Representative images showing co-internalization of HA-μ-OR and Myc-δ-OR in HEK-293T cells after 45 minutes of exposure to DAMGO (5 μM), DALDA (5 μM), or CYM51010 (5 μM). (B) Upper: Diagram depicts HA-μ-OR (green) and Myc-δ-OR (red) at the cell surface. Lower: Quantification of μ-OR and δ-OR internalization at 45 minutes after drug treatment. (C) Representative images and quantification of μ-OR internalization in HEK-293T cells transfected with HA-μ-OR alone and exposed for 45 minutes to DAMGO (5 μM) or CYM51010 (5 μM). (D) Representative images and quantification of δ-OR internalization in HEK-293T cells transfected with Myc-δ-OR alone and exposed for 45 minutes to deltorphin I (5 μM) or CYM51010 (5 μM). Scale bar: 10 μm. n = 15–17/group. One-way ANOVA and Bonferroni post hoc test. **p < 0.01, ***p < 0.001 versus control; ##p < 0.01 versus DAMGO and deltorphin I in C and D, respectively. Data are mean ± SEM.
