

Introduction
Over the past 20 years, escalating rates of opioid prescribing in the United States has contributed to the national opioid overdose epidemic[34]. While most of the research in this area has focused on characterizing opioid use in adults, emerging evidence suggests that the opioid epidemic also affects adolescents in significant numbers. Over a similar time period, increased opioid prescribing to adolescents was followed by increased rates of opioid misuse and hospitalization[9; 11; 12; 22; 32]. Indeed, recently McCabe et al., using cross-sectional data from the 2015 and 2016 National Survey on Drug Use and Health, found that 17.2% of adolescents in the United States used opioids as prescribed by a physician, while 3.8% misused opioids [26]. Among adolescents, opioid use is correlated with sociodemographic, physical and mental health factors. In particular, White, non-Hispanic adolescents are considered more likely to receive opioid prescriptions[17] and be at higher risk for opioid misuse as compared to minority adolescents, while females are slightly more likely to misuse opioids as compared to males[32]. Furthermore, a few other studies have examined reasons[5] for opioid misuse. among adolescents, finding that self-treating pain is a common motivator for opioid misuse.[23]
However, there is some evidence that the opioid crisis is shifting among the adolescent population[13], in particular, sociodemographic factors associated with prescription opioid misuse may be changing [25; 32]. Indeed, rates of opioid-related overdose and mortality are still increasing among adolescents and it is estimated that 12.4% of all deaths among 15–24 year olds in the United States are directly attributable to opioids[9; 15]. Given the overall impact of the opioid crisis, it is therefore important that we closely track any changes in prevalence or risk factors. Such knowledge could help formulate a better understanding of how adolescents use opioids and inform efforts to reduce opioid-associated harms[10]. Furthermore, considering that opioid misuse frequently starts during adolescence and may contribute to adult misuse any long-term public health strategy aimed at effectively addressing the opioid epidemic will require targeting this critical population[26; 28].
To improve our understanding of recent changes in the opioid epidemic, we took advantage of data available in the 2015–2016 National Survey on Drug Use and Health (NSDUH). The 2015–2016 NSDUH collected data on correlates of prescription opioid use, misuse, and OUD, while also surveying participants about motives of opioid misuse. Our first aim was to determine whether the prevalence of prescription opioid use, prescription opioid misuse, and prescription OUD among 12–17-year olds in the United States differ according to sociodemographic, physical and mental health, and substance use characteristics. We hypothesized thast opioid misuse and OUD would be more common among females, white, non-Hispanic adolescents, and those who use other illicit substances. Our second aim was to determine the motivations for opioid misuse by adolescents and determine whether motivations for misuse were associated with sociodemographic, physical, or mental health factors. We hypothesized that most adolescents would report self-treating physical pain as a main motivator for prescription opioid misuse.
Methods:
Participants
Cross-sectional data from the 2015 and 2016 NSDUH were analyzed. The NSDUH is a nationally representative sample of households conducted each year to provide up-to-date information on opioid use, substance use, and other health issues in the United States. In-person interviews were conducted with household members 12 years and older. For sensitive items, such as questions about opioid misuse, the NSDUH uses audio computer-assisted self-interviewing (ACASI). For ACASI questions, the participant wore headphones to hear all questions and the field interviewer stayed out of view of the computer screen, thus ensuring privacy and confidentiality [25]. A total of 114,043 respondents were sampled in the 2015 and 2016 NSDUH. Of these, 27,857 were 12–17 years of age. No subjects were surveyed in both years. The 2015 and 2016 NSDUH are the most recent rounds of data publicly available. These data are not directly comparable to previous years of NSDUH because 2015 was the first year that participants were asked about medical prescription opioid use[19]. The NSDUH data are publicly available and de-identified, and therefore exempt from review by the institutional review board at our institution.
Measures
Opioid Use, Misuse, and OUD
NSDUH surveyed participants about prescription opioid use, prescription opioid misuse, and prescription OUD during the preceding 12 months. NSDUH creates a composite variable from responses to questions on past year and lifetime prescription opioid use to determine whether participants used any prescription opioids in the past year. Those who reported past year prescription opioid use, but denied misuse, were categorized as “Prescription opioid use without misuse”. The NSDUH then asked participants about past year opioid misuse, which was defined as using opioids in any way “that a doctor did not direct you to use them, including 1) use without a prescription of your own; 2) use in greater amounts, more often, or longer than you were told to take them; or 3) use in any other way a doctor did not direct you to use them”. Participants who misused opioids in the past 12 months were classified as “Prescription opioid misuse without OUD”. Information on prescription OUD was obtained from a set of structured questions based on criteria for opioid abuse and opioid dependence from the Diagnostic and Statistical Manual of Mental Disorders, Fourth Edition (DSM-IV)[1]. NSDUH provides a summary variable for prescription opioid use disorder based on whether the respondent endorsed 1 of the 4 abuse questions and/or 3 of the 7 dependence questions. Participants who matched this summary variable were categorized as “Prescription OUD”.
Main Reasons for Misuse
Motivations for opioid misuse were measured in the subsample of participants who reported prescription opioid misuse in the past year. Participants who endorsed opioid misuse were asked about the main reasons for misuse with a multiple choice question that contained the following response options: “to relieve physical pain; to relax or relieve tension; to experiment/see what the drug was like; to feel good/get high;, to help with sleep; to help with feelings or emotions; to increase or decrease the effects of other drugs; because I was “hooked” or had to have it; or some other reason.”
Sociodemographics
Sociodemographic information captured included sex (male/female), race and ethnicity (white, non-Hispanic; black, non-Hispanic; Hispanic; and other), family income (< $20,000, $20,000 - $49,999, $50,000 - $74,999, $75,000 and over), and urban status (large metro, small metro, nonmetro).
Physical and mental health
Participants were asked to rate their physical health over the past 12 months with 5 response options of excellent, very good, good, fair, or poor. Based on a series of questions, NSDUH identified participants who had a major depressive episode during the past year (yes/no) that met DSM-IV criteria[1].
Substance use
Participants reported whether, over the past year they used any of the following at least once: 1) tobacco, 2) alcohol, 3) marijuana, 4) heroin, or 5) whether they used any other illicit drugs over the past month.
Statistical analysis
All analyses were conducted using the survey package contained in Stata version 14.2 (StataCorp College Station, TX); α was set at .05. We accounted for the complex sampling design of NSDUH by using analytic weights, regional stratification, and primary sampling unit information to provide nationally representative estimates of the USA population.
To address our first aim, we performed multivariable multinomial logistic regression analysis to determine associations of opioid use (no opioid use; opioid use; opioid misuse; and OUD) with sociodemographic characteristics, self-reported health variables, major depressive episodes, and substance use variables among adolescents. In our multinomial models, “no opioid use” was specified as the reference group for the 3 opioid use outcomes: (1) opioid use without misuse, (2) opioid misuse without use disorder, and (3) OUD. Results are presented as relative risk ratios with 95% confidence intervals.
To address the second aim, we assessed the main motivations for opioid misuse among adolescents. We then used multivariate multinomial regression analysis to determine characteristics associated with the main motivation for opioid misuse (pain-relief; other reasons). These characteristics included sociodemographic variables, self-reported health variables, major depressive episodes, and substance use variables. In this analysis, “no opioid misuse” was specified as the reference group. Finally, we also performed multivariate logistic regression analysis to compare characteristics of adolescents who reported pain-relief as the major reason for misuse directly to adolescents who reported other reasons for misuse.
Results
Factors associated with opioid misuse and opioid use disorder among adolescents.
Characteristics of the adolescent sample according to level of opioid use are presented in Table 1.
Table 1.
Sociodemographic characteristics, self-reported health, major depressive episode, and substance use of adolescents 12–17 years of age by level of opioid use in the United States 2015–2016.
| Number of participants | Opioid use without misuse | Opioid misuse without use disorder | Opioid use disorder | |
|---|---|---|---|---|
| Sex | ||||
| Male | 14196 | 16.2 (15.5–17.0) | 3.2 (2.8–3.6) | 0.4 (0.3–0.5) |
| Female | 13661 | 18.3 (17.3–19.2) | 3.2 (2.9–3.6) | 0.8 (0.6–1.0) |
| Race and ethnicity | ||||
| White, Non-Hispanic | 14935 | 17.6 (16.8–18.3) | 3.1 (2.8–3.5) | 0.5 (0.4–0.7) |
| Black, non-Hispanic | 3621 | 18.5 (16.7–20.5) | 3.7 (3.2–4.3) | 0.5 (0.3–0.8) |
| Hispanic | 6134 | 16.5 (15.2–17.9) | 3.2 (2.6–3.9) | 0.8 (0.6–1.1) |
| Other, non-Hispanic | 3167 | 15.3 (13.1–17.8) | 2.8 (2.1–3.7) | 0.4 (0.2–0.7) |
| Total family income | ||||
| Less than $20,000 | 4697 | 17.5 (16.3–18.8) | 3.6 (3.0–4.3) | 0.4 (0.3–0.7) |
| $20,000 - $49,999 | 8036 | 17.3 (16.3–18.5) | 3.4 (3.0–3.9) | 0.8 (0.6–1.0) |
| $50,000 - $74,999 | 4233 | 18.2 (16.7–19.9) | 2.8 (2.2–3.5) | 0.6 (0.3–1.2) |
| $75,000 or More | 10891 | 16.7 (15.8–17.6) | 3.1 (2.6–3.6) | 0.5 (0.3–0.7) |
| County metro/nonmetro status | ||||
| Large Metro | 6379 | 14.9 (13.9–16.0) | 2.8 (2.4–3.3) | 0.5 (0.4–0.8) |
| Small Metro | 5059 | 16.6 (15.4–17.8) | 2.9 (2.3–3.7) | 0.8 (0.5–1.30 |
| Nonmetro | 2834 | 15.9 (14.2–17.8) | 3.0 (2.3–4.0) | 0.7 (0.4–1.3) |
| Self reported overall health | ||||
| Excellent | 9481 | 15.8 (14.6–17.1) | 2.4 (2.0–2.9) | 0.2 (0.1–0.4) |
| Very Good | 11528 | 17.4 (16.5–18.3) | 3.3 (2.9–3.8) | 0.5 (0.4–0.8) |
| Good | 5748 | 19.1 (17.9–20.5) | 4 (3.4–4.7) | 0.9 (0.6–1.3) |
| Fair/Poor | 1094 | 18.4 (15.7–21.4) | 4.9 (3.5–6.7) | 2.1 (1.2–3.5) |
| Major depressive episode | ||||
| No | 23548 | 16.5 (15.8–17.2) | 2.7 (2.4–3.0) | 0.3 (0.2–0.4) |
| Yes | 3540 | 22.6 (20.4–24.9) | 6.4 (5.5–7.4) | 2.2 (1.6–3.1) |
| Any tobacco use past year | ||||
| No | 24615 | 16.5 (15.8–17.1) | 2.1 (1.8–2.3) | 0.3 (0.2–0.4) |
| Yes | 3242 | 23.4 (21.6–25.3) | 12.4 (11.2–13.6) | 2.7 (2.1–3.4) |
| Any alcohol use past year | ||||
| No | 21590 | 15.3 (14.6–16.1) | 1.6 (1.4–1.9) | 0.2 (0.1–0.3) |
| Yes | 6267 | 23.8 (22.5–25.1) | 8.6 (8.0–9.3) | 1.8 (1.4–2.3) |
| Any marijuana use past year | ||||
| No | 24285 | 16.8 (16.2–17.5) | 1.8 (1.6–2.1) | 0.3 (0.2–0.4) |
| Yes | 3572 | 20.1 (18.4–21.9) | 12.8 (11.5–14.2) | 2.7(2.1–3.6) |
| Any illegal substance use past month (excluding marijuana) | ||||
| No | 27080 | 17.3 (16.7–18.0) | 2.1 (1.9–2.4) | 0.2 (0.2–0.3) |
| Yes | 777 | 14.2 (10.8–18.4) | 42.5 (38.1–47.0) | 12.7 (9.9–16.1) |
| Any heroin use past year | ||||
| No | 27835 | 17.2 (16.6–17.9) | 3.2 (2.9–3.5) | 0.6 (0.4–0.7) |
| Yes | 22 | 36.8 (16.9–62.4) | 19.8 (6.8–45.9) | 12.8 (3.4–38.0) |
All values are weighted percentages (95% confidence intervals)
Results of multivariable multinomial logistic regression determining associations of sociodemographic characteristics, health variables, and substance use variables with level of opioid use (prescription opioid use without misuse, misuse, and use disorders) are shown in Table 2. In univariate analysis, rates of prescription opioid use were slightly higher in females than males (Table 1); however, after controlling for covariables, females were no more likely than males to use or misuse opioids. Black, non-Hispanic adolescents had 20% increased odds of using opioids and 50% increased odds of misusing opioids as compared to White, non-Hispanic adolescents (Table 2). Rates of opioid misuse tended to decrease as family income increased, but did not reach statistical significance. County metro status was not associated with opioid use. Overall self-reported physical health was associated with opioid use; individuals rating their health as good or fair/poor were more likely to use opioids as compared to those with excellent or very good health. Additionally, adolescents with fair or poor self-reported health were more likely to both misuse opioids and have OUD. Having at least one major depressive episode increased the likelihood of all forms of opioid use. Adolescent use of tobacco, alcohol, marijuana, and other illicit substances were all associated with increased levels of opioid use, except that using marijuana was not associated with increased risk for opioid use disorder. Although heroin use during the past year was not statistically associated with opioid use, misuse, or opioid use disorder, there were very few cases of reported heroin use among adolescent participants in 2015–2016 (Table 1).
Table 2.
Associations of sociodemographic characteristics, self-reported health, major depressive episode, and substance use with level of opioid use among adolescents 12–17 years of age, United States: 2015–2016 National Survey on Drug Use and Health.
| Opioid use | Opioid misuse | Opioid use disorder | |
|---|---|---|---|
| Sex | |||
| Male | 1.0 | 1.0 | 1.0 |
| Female | 1.1 (0.9–1.2) | 0.8 (0.6–1.1) | 1.5 (0.8–2.9) |
| Race and ethnicity | |||
| White, Non-Hispanic | 1.0 | 1.0 | 1.0 |
| Black, non-Hispanic | 1.2 (1.0–1.5)* | 1.5 (1.1–2.1)* | 1.2 (0.3–4.6) |
| Hispanic | 0.9 (0.8–1.1) | 0.9 (0.6–1.4) | 1.7 (0.7–3.8) |
| Other, non-Hispanic | 0.9 (0.7–1.2) | 0.9 (0.5–1.7) | 0.8 (0.4–1.9) |
| Total family income | |||
| Less than $20,000 | 1.0 | 1.0 | 1.0 |
| $20,000 - $49,999 | 1.0 (0.8–1.2) | 0.8 (0.5–1.2) | 1.2 (0.5–3.3) |
| $50,000 - $74,999 | 1.1 (0.8–1.3) | 0.5 (0.3–0.9) * | 1.0 (0.2–4.4) |
| $75,000 or More | 0.9 (0.8–1.1) | 0.6 (0.4–1.0) | 1.1 (0.4–3.1) |
| County metro/nonmetro status | |||
| Large Metro | 1.0 | 1.0 | 1.0 |
| Small Metro | 1.1 (1.0–1.3) | 1.0 (0.7–1.4) | 1.2 (0.6–2.3) |
| Nonmetro | 1.0 (0.9–1.2) | 1.2 (0.8–1.8) | 1.8 (0.8–4.0) |
| Self reported overall health | |||
| Excellent | 1.0 | 1.0 | 1.0 |
| Very Good | 1.2 (1.0–1.4) * | 1.4 (1.0–1.9) | 1.3 (0.0–3.5) |
| Good | 1.4 (1.1–1.6) ** | 1.2 (0.8–1.9) | 1.7 (0.6–4.8) |
| Fair/Poor | 1.4 (1.0–2.0) * | 2.0 (1.1–3.9) * | 7.3 (2.3–23.3) ** |
| Major depressive episode | |||
| No | 1.0 | 1.0 | 1.0 |
| Yes | 1.4 (1.2–1.7)*** | 1.8 (1.0–2.4)*** | 3.9 (2.0–7.5)*** |
| Any tobacco use past year | |||
| No | 1.0 | 1.0 | 1.0 |
| Yes | 1.5 (1.2–1.9)** | 2.3 (1.7–3.2)*** | 1.8 (0.9–3.6) |
| Any alcohol use past year | |||
| No | 1.0 | 1.0 | 1.0 |
| Yes | 1.9 (1.6–2.3)** | 2.9 (2.0–4.1) | 2.6 (1.3–5.4)* |
| Any marijuana use past year | |||
| No | 1.0 | 1.0 | 1.0 |
| Yes | 0.8 (0.6–1.0) * | 2.1 (1.3–3.5) ** | 1.3 (0.6–2.9) |
| Any illegal substance use past month (excluding marijuana) | |||
| No | 1.0 | 1.0 | 1.0 |
| Yes | 1.8 (1.1–2.8) * | 23.9 (16.1–35.7) *** | 119.9 (50.7–283.2) *** |
| Any heroin use past year | |||
| No | 1.0 | 1.0 | 1.0 |
| Yes | 3.1 (0.3–31.5) | 1.1 (0.1–12.9) | 0.2 (0.0–7.7) |
Relative risk ratios (95% confidence intervals) are shown.
(p < .05,
p < .01,
p < .001).
Note: In each column the cohort of adolescents with “no opioid use” is the reference group.
Reasons for Misuse
Among adolescents with prescription opioid misuse, the main reason for misuse was relief of physical pain (50%, 95% CI 46–54%), followed by wanting to “get high” (17%, 95% CI 14–20%), to relax (11%, 95% CI 8–13%), and to experiment (9%, 95% CI 7–11%) (Figure 1). Both adolescents who reported pain-relief as the main motivation for prescription opioid misuse and adolescents who reported other reasons for opioid misuse had significantly greater odds of a major depressive episode and substance use as compared to adolescents who did not report any opioid misuse (Table 3). We also found that Black, non-Hispanic adolescents had increased odds of pain relief as the as the major motivator for misuse as compared to white, non-Hispanic adolescents. However, adolescents who reported pain-relief as the main reason for opioid misuse had much lower odds of substance use behaviors as compared to adolescents reporting other reasons for opioid misuse (Table 4). None of the other characteristics were associated with reporting pain as the main reason for opioid misuse.
Figure 1.
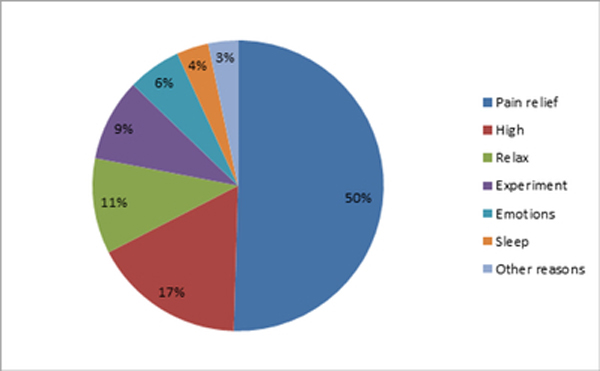
Main reason for misuse of opioids among adolescents captured in the 2015–2016 National Survey on Drug Use and Health
Table 3.
Multivariable multinomial logistic regression analysis of associations of sociodemographic characteristics, self-reported health, major depressive episode, and substance use with pain relief as the major motivator for misuse versus no opioid misuse & other motivation versus no opioid misuse among adolescents 12–17 years of age, United States: 2015–2016 National Survey on Drug Use and Health.
| Pain-relief versus No opioid misuse | Other motivations versus No opioid misuse | |
|---|---|---|
| Sex | ||
| Male | 1.0 | 1.0 |
| Female | 1.0 (0.7–1.4) | 0.8 (0.6–1.0) |
| Race and ethnicity | ||
| White, non-Hispanic | 1.0 | 1.0 |
| Black, non-Hispanic | 1.5 (1.1–2.0) ** | 1.2 (0.9–1.8) |
| Hispanic | 1.1 (0.7–1.8) | 1.1 (0.8–1.5) |
| Other, non-Hispanic | 0.9 (0.6–1.3) | 0.9 (0.5–1.5) |
| Total family income | ||
| Less than $20,000 | 1.0 | 1.0 |
| $20,000 - $49,999 | 1.2 (0.8–1.7) | 1.0 (0.7–1.5) |
| $50,000 - $74,999 | 0.8 (0.5–1.1) | 1.0 (0.6–1.6) |
| $75,000 or More | 1.0 (0.7–1.4) | 1.0 (0.7–1.5) |
| Self-reported overall health | ||
| Excellent | 1.0 | 1.0 |
| Very Good | 1.3 (1.0–1.7) | 1.3 (1.0–1.8) |
| Good | 1.4 (1.0–1.9)* | 1.6 (1.1–2.3)** |
| Fair/Poor | 1.6 (0.9–3.0) | 2.3 (1.3–3.8)** |
| Major depressive episode | ||
| No | 1.0 | 1.0 |
| Yes | 1.7 (1.3–2.2)*** | 2.4 (1.9–3.0)*** |
| Any history of substance use | ||
| No | 1.0 | 1.0 |
| Yes | 5.4 (4.0–7.4)*** | 24.3 (16.4–36.0)*** |
(p < .05,
p < .01,
p < .001).
Table 4.
Multivariate logistic regression analysis of associations of sociodemographic characteristics, self-reported health, major depressive episode, and substance use with pain relief (versus all other reasons) as the main reason for prescription opioid misuse among adolescents 12–17 years of age, United States: 2015–2016 National Survey on Drug Use and Health.
| Adjusted Odds Ratio (95% Confidence Interval) |
|
|---|---|
| Sex | |
| Male | 1.0 |
| Female | 1.3 (0.8–2.0) |
| Race and ethnicity | |
| White, non-Hispanic | 1.0 |
| Black, non-Hispanic | 1.3 (0.8–2.2) |
| Hispanic | 1.0 (0.7–1.6) |
| Other, non-Hispanic | 0.7 (0.4–1.3) |
| Total family income | |
| Less than $20,000 | 1.0 |
| $20,000 - $49,999 | 1.2 (0.6–2.2) |
| $50,000 - $74,999 | 0.8 (0.4–1.4) |
| $75,000 or More | 1.0 (0.6–1.6) |
| Self-reported overall health | |
| Excellent | 1.0 |
| Very Good | 0.9 (0.6–1.4) |
| Good | 0.8 (0.6–1.2) |
| Fair/Poor | 0.7 (0.3–1.6) |
| Major depressive episode | |
| No | 1.0 |
| Yes | 1.1 (0.7–1.7) |
| Any history of substance use | |
| No | 1.0 |
| Yes | 0.3 (0.2–0.4) *** |
(p < .05,
p < .01,
p < .001).
Discussion
We sought to enhance understanding of the epidemiology of prescription opioid use, misuse, and use disorders among adolescents in the U.S. by presenting recent data on correlates of prescription opioid use, while also determining motives of prescription opioid misuse. We found race and ethnic differences in rates of opioid use that is different from previous reports. Specifically, Black, non-Hispanic adolescents had increased odds of both opioid use and opioid misuse as compared to White, non-Hispanic adolescents. We also found that 50% of adolescents reported self-treating physical pain as the major reason for prescription opioid misuse.
Previously reported rates of opioid use among adolescents in the United States ranged from 5–15%, depending on the database analyzed. For example, Groenewald et al. examined nationally representative data from the Medical Expenditure Panel Survey and found that 5% of adolescents used opioids in 2012[16]. Among the Tennessee Medicaid population, 15% used opioids in 2015[8]. In a large commercial insured population of adolescents, 5% used an opioid in 2013 [4]. Each of these databases have their strengths and limitations, however the NSDUH database is unique in that participants are specifically asked to self-report opioid use and misuse using ACASI format. ACASI protects individuals’ privacy and confidentiality and is expected to increase honesty in reporting (i.e. greater validity). Thus, data from the 2015–2016 NSDUH provides a relatively accurate source of information on opioid use among adolescents in the United States.
Rates of opioid misuse reported in the 2015–2016 NSDUH appear lower than rates reported by Vaughan et al. using the 2004–2013 NSDUH[32], however this may be due to changes in how questions about opioid misuse were framed in 2015. Interestingly, Vaughan et al. found that rates of prescription opioid misuse significantly decreased among White adolescents but did not decrease among Black and Hispanic adolescents between 2004–2013. These findings from NSDUH may be compared to data from the Monitoring the Future (MTF) study, another large nationally representative study tracking patterns of opioid use and misuse over time. MTF data also suggests that rates of opioid misuse have declined among White adolescents from 2001 to 2015, however rates of opioid misuse appeared to increase among Black and Hispanic adolescents[25]. Indeed, we found that Black, non-Hispanic adolescents were more likely to use prescription opioids as directed by a physician and were also at increased risk for opioid misuse as compared to White, non-Hispanic adolescents. Our finding and the findings from the most recent MTF data stand in sharp contrast to prior literature on race and opioid use. Data from the Medical Expenditure Panel Survey in 2012 found that white, non-Hispanic adolescents were more likely to receive opioid prescriptions as compared to minority adolescents [18]. Taken together, this suggests a demographic shift in opioid use over time with minorities now as likely to report opioid use as white adolescents. Contributing factors likely include an overall decline in opioid use and misuse among the White, non-Hispanic population. On the other hand, providers may be more aware of disparities in care for minorities which may have resulted in closure of the gap in opioid prescribing based on race by increasing opioid prescribing to minorities. However, we also found that Black, non-Hispanic adolescents had increased odds of reporting pain-relief as a major reason for prescription opioid misuse. Race and ethnic differences in pain care is well documented[3] and our findings may indicate that minority adolescents have less access to other, non-opioid forms of pain relief. This is an important finding that deserves further research. In contrast to our hypothesis, we did not find a difference in opioid misuse between males and females confirming previous work which found that while sex-differences in opioid misuse were reported in the early 2000’s the gap has closed over time[25; 32].
We found that around 50% of adolescents misused opioids to self-treat physical pain while previous studies found that 79 [5] – 84% [24] of adolescents reported opioid misuse primarily to self-treat pain. This again highlights the importance of educating adolescents and their parents about the dangers of opioid misuse and teaching safe storage (e.g., locking opioids in a container) and disposal (e.g., mixing opioids with coffee grounds) practices[6; 27]. Although the rate in our study was lower than found in older studies, it is still concerning. Chronic pain affects 15–25% of adolescents and a history of adolescent chronic pain increases risk for problems into adulthood such as persistent pain and mental health concerns[20; 21; 29]. Previous studies in adolescents found that those who misuse opioids to self-treat pain had lower rates of substance use behaviors (as compared to those who misuse for other reasons). Our results fit with these reports. However, adolescents who reported pain as their main motivation for misuse had increased rates of substance use as compared to the general adolescent population. This finding suggests that providers should screen for mental health conditions and substance use behaviors even among those adolescents that report pain as a major motivation for opioid misuse. Indeed, pain in adolescence is considered a strong risk factor for future opioid misuse[16].
Regardless, distinguishing adolescents who self-treat pain from those who use opioids for other reasons, such as getting high, is of clinical importance, because their treatment calls for different forms of intervention. Those with pain had lower overall odds of substance abuse behaviors (as compared to those misusing for other reasons) and may benefit from education about risks, frequent follow-up for pain complaints, and non-opioid and non-pharmacological pain therapies[24; 35]. On the other hand, adolescents who use opioids for getting high could benefit from external regulation of aberrant behaviors and substance abuse treatment[36]. Regardless, recent studies suggest that a large proportion of adolescents and their parents still lack basic understanding about the risks posed by opioids, for example: 66% of parents plan on keeping unused opioids at home for future needs, with fewer than 30% practicing safe storage[14]. This is concerning, because opioids are relatively overprescribed to youth with >50% of opioids prescribed going unused, forming a reservoir for future opioid misuse[33]. This reservoir is a common source of misuse for adolescents who self-treat pain[31]. Consequently, health care providers can play a role in minimizing opioid misuse behaviors by limiting leftover medications and providing follow up to identify unmet treatment needs.
Opioid guidelines aimed at adolescents have been much more restrictive as compared to adult guidelines. For example, the state of Washington’s Health Care Authority introduced a clinical policy aimed at reducing opioid prescribing to adolescents to 3 days or less [2]. However, while more appropriate opioid prescribing guidelines are clearly needed, we also want to caution prescribers against undertreating adolescents’ pain. Acute pain that is not adequately controlled can in itself lead to significant long-term morbidity[30]. As adolescent opioid prescribing rates go down, it is important that clinicians consider other, non-opioid pain treatments to provide pain relief, which may avoid future misuse and other substance use. Furthermore, given how pervasive opioids are in the United States, reducing the prescription opioid crisis affecting adolescents starts with reducing the amount of opioid available to society as a whole [7].
Our work has several limitations. First, because this is a cross-sectional analysis, we are unable to establish causal relationships between opioid use and its associated factors. For example, our results suggest that adolescents use opioids to self-treat pain, however it is also plausible that some adolescents may develop opioid-induced hyperalgesia due to long-term opioid misuse. Second, opioid use is a sensitive topic and, while the NSDUH methodology addresses this to some extent, participants may still not have felt comfortable disclosing opioid use on the survey, potentially under-reporting opioid use. Further, several limitations inherent to the NSDUH database should be considered. Participants self-reported opioid use, thus data are subject to recall bias. Participation in NSDUH is voluntary, which may have resulted in self-selection bias by participants that may have differed by opioid use. For example, self-selection bias could explain the increased legitimate opioid use found in our data as compared to other databases not specifically focused on opioid use.
Our study has several strengths as compared to previous research in this area. First, data from NSDUH is broadly generalizable to the adolescent population in the United States. Secondly, NSDUH used ACASI for questions on opioid use ensuring privacy and confidentiality.
In conclusion, we examined correlates of prescription opioid use and found that Black, non-Hispanic adolescents now are more likely to use and misuse opioids as compared to White adolescents, a clear shift from earlier research findings. Females had similar rates of prescription opioid misuse as compared to males. Self-treating pain remains a major motivator for prescription opioid misuse. The opioid epidemic remains a pressing health concern facing adolescents in America. There are limitations related to large database research in this area and there exists a need for longitudinal research to understand factors predicting opioid use during the transition from adolescence to young adulthood.
Acknowledgments
Funding source: This work was partially funded by grants from the National Institutes of Health: grant number K23HL138155 awarded to CBG and grant number K23HD078239 awarded to JAR.
Financial Disclosure: The authors have no financial relationships relevant to disclose.
Footnotes
Conflict of interest: The authors have no conflicts of interest to disclose.
References
- [1].Diagnostic and Statistical Manual of Mental Disorders (DSM-IV). Washington, DC: American Psychiatric Association, 1994. [Google Scholar]
- [2].Washington State Health Care Authority. Apple Health (Medicaid) Opioid Clinical Policy. Accessed October 18th 2018 available at https://www.hca.wa.gov/billers-providers-partners/programs-and-services/opioids
- [3].Anderson KO, Green CR, Payne R. Racial and ethnic disparities in pain: causes and consequences of unequal care. J Pain 2009;10(12):1187–1204. [DOI] [PubMed] [Google Scholar]
- [4].Banerjee S, Roland CL, Willke R, Mardekian J, Garrison LP Jr. Prevalence of and Comorbid Health Conditions Associated With Pediatric Prescription Opioid Use in the US . J Pain Palliat Care Pharmacother 2017;31(3–4):218–227. [DOI] [PubMed] [Google Scholar]
- [5].Boyd CJ, McCabe SE, Cranford JA, Young A. Adolescents’ motivations to abuse prescription medications. Pediatrics 2006;118(6):2472–2480. [DOI] [PMC free article] [PubMed] [Google Scholar]
- [6].Brown DW, Anda RF, Felitti VJ, Edwards VJ, Malarcher AM, Croft JB, Giles WH Adverse childhood experiences are associated with the risk of lung cancer: a prospective cohort study. BMC Public Health 2010;10:20. [DOI] [PMC free article] [PubMed] [Google Scholar]
- [7].Burghardt LC, Ayers JW, Brownstein JS, Bronstein AC, Ewald MB, Bourgeois FT Adult prescription drug use and pediatric medication exposures and poisonings. Pediatrics 2013;132(1):18–27. [DOI] [PMC free article] [PubMed] [Google Scholar]
- [8].Chung CP, Callahan ST, Cooper WO, Dupont WD, Murray KT, Franklin AD, Hall K, Dudley JA, Stein CM, Ray WA Outpatient Opioid Prescriptions for Children and Opioid-Related Adverse Events. Pediatrics 2018;142(2). [DOI] [PMC free article] [PubMed] [Google Scholar]
- [9].Curtin SC, Tejada-Vera B, Warmer M. Drug Overdose Deaths Among Adolescents Aged 15–19 in the United States: 1999–2015. NCHS Data Brief 2017(282):1–8. [PubMed] [Google Scholar]
- [10].Dowell D, Haegerich TM, Chou R. CDC Guideline for Prescribing Opioids for Chronic Pain - United States, 2016. MMWR Recomm Rep 2016;65(1):1–49. [DOI] [PubMed] [Google Scholar]
- [11].Fortuna RJ, Robbins BW, Caiola E, Joynt M, Halterman JS Prescribing of controlled medications to adolescents and young adults in the United States. Pediatrics 2010;126(6):1108–1116. [DOI] [PubMed] [Google Scholar]
- [12].Gaither JR, Leventhal JM, Ryan SA, Camenga DR National Trends in Hospitalizations for Opioid Poisonings Among Children and Adolescents, 1997 to 2012. JAMA Pediatr 2016;170(12):1195–1201. [DOI] [PMC free article] [PubMed] [Google Scholar]
- [13].Gaither JR, Shabanova V, Leventhal JM US National Trends in Pediatric Deaths From Prescription and Illicit Opioids, 1999–2016. JAMA Netw Open 2018;1(8):e186558. [DOI] [PMC free article] [PubMed] [Google Scholar]
- [14].Garbutt JM, Kulka K, Dodd S, Sterkel R, Plax K. Opioids in Adolescents’ Homes: Prevalence, Caregiver Attitudes, and Risk Reduction Opportunities. Acad Pediatr 2018. [DOI] [PMC free article] [PubMed] [Google Scholar]
- [15].Gomes T, Tadrous M, Mamdani MM, Paterson JM, Juurlink DN The Burden of Opioid-Related Mortality in the United States. JAMA Network Open 2018;1(2):e180217. doi: 10.181001/jamanetworkopen.182018.180217. [DOI] [PMC free article] [PubMed] [Google Scholar]
- [16].Groenewald CB, Law EF, Fisher E, Beals-Erickson SE, Palermo TM Associations Between Adolescent Chronic Pain and Prescription Opioid Misuse in Adulthood . J Pain 2018. [DOI] [PMC free article] [PubMed] [Google Scholar]
- [17].Groenewald CB, Rabbitts JA, Gebert JT, Palermo TM Trends in opioid prescriptions among children and adolescents in the United States: a nationally representative study from 1996 to 2012. Pain 2016;157(5):1021–1027. [DOI] [PMC free article] [PubMed] [Google Scholar]
- [18].Groenewald CB, Rabbitts JA, Hansen EE, Palermo TM Racial differences in opioid prescribing for children in the United States. Pain 2018;159(10):2050–2057. [DOI] [PMC free article] [PubMed] [Google Scholar]
- [19].Han B, Compton WM, Blanco C, Crane E, Lee J, Jones CM Prescription Opioid Use, Misuse, and Use Disorders in U.S. Adults: 2015 National Survey on Drug Use and Health. Ann Intern Med 2017;167(5):293–301. [DOI] [PubMed] [Google Scholar]
- [20].Hassett AL, Hilliard PE, Goesling J, Clauw DJ, Harte SE, Brummett CM Reports of chronic pain in childhood and adolescence among patients at a tertiary care pain clinic. J Pain 2013;14(11):1390–1397. [DOI] [PubMed] [Google Scholar]
- [21].King S, Chambers CT, Huguet A, MacNevin RC, McGrath PJ, Parker L, MacDonald AJ The epidemiology of chronic pain in children and adolescents revisited: a systematic review. Pain 2011;152(12):2729–2738. [DOI] [PubMed] [Google Scholar]
- [22].Martins SS, Segura LE, Santaella-Tenorio J, Perlmutter A, Fenton MC, Cerda M, Keyes KM, Ghandour LA, Storr CL, Hasin DS Prescription opioid use disorder and heroin use among 12–34 year-olds in the United States from 2002 to 2014. Addict Behav 2017;65:236–241. [DOI] [PMC free article] [PubMed] [Google Scholar]
- [23].McCabe SE, West BT, Boyd CJ Leftover prescription opioids and nonmedical use among high school seniors: a multi-cohort national study. J Adolesc Health 2013;52(4):480–485. [DOI] [PMC free article] [PubMed] [Google Scholar]
- [24].McCabe SE, West BT, Boyd CJ Motives for medical misuse of prescription opioids among adolescents. J Pain 2013;14(10):1208–1216. [DOI] [PMC free article] [PubMed] [Google Scholar]
- [25].McCabe SE, West BT, Veliz P, McCabe VV, Stoddard SA, Boyd CJ Trends in Medical and Nonmedical Use of Prescription Opioids Among US Adolescents: 1976–2015. Pediatrics 2017;139(4). [DOI] [PMC free article] [PubMed] [Google Scholar]
- [26].McCabe SE, Wilens TE, Boyd CJ, Chua KP, Voepel-Lewis T, Schepis TS Age-specific risk of substance use disorders associated with controlled medication use and misuse subtypes in the United States. Addict Behav 2019;90:285–293. [DOI] [PMC free article] [PubMed] [Google Scholar]
- [27].McDonald EM, Kennedy-Hendricks A, McGinty EE, Shields WC, Barry CL, Gielen AC Safe Storage of Opioid Pain Relievers Among Adults Living in Households With Children. Pediatrics 2017;139(3). [DOI] [PubMed] [Google Scholar]
- [28].Miech R, Johnston L, O’Malley PM, Keyes KM, Heard K. Prescription Opioids in Adolescence and Future Opioid Misuse. Pediatrics 2015;136(5):e1169–1177. [DOI] [PMC free article] [PubMed] [Google Scholar]
- [29].Noel M, Groenewald CB, Beals-Erickson SE, Gebert JT, Palermo TM Chronic pain in adolescence and internalizing mental health disorders: a nationally representative study. Pain 2016;157(6):1333–1338. [DOI] [PMC free article] [PubMed] [Google Scholar]
- [30].Rabbitts JA, Zhou C, Groenewald CB, Durkin L, Palermo TM Trajectories of postsurgical pain in children: risk factors and impact of late pain recovery on long-term health outcomes after major surgery. Pain 2015;156(11):2383–2389. [DOI] [PMC free article] [PubMed] [Google Scholar]
- [31].Schepis TS, Wilens TE, McCabe SE Prescription Drug Misuse: Sources of Controlled Medications in Adolescents. J Am Acad Child Adolesc Psychiatry 2019;58(7):670–680 e674. [DOI] [PMC free article] [PubMed] [Google Scholar]
- [32].Vaughn MG, Nelson EJ, Salas-Wright CP, Qian Z, Schootman M. Racial and ethnic trends and correlates of non-medical use of prescription opioids among adolescents in the United States 2004–2013. J Psychiatr Res 2016;73:17–24. [DOI] [PubMed] [Google Scholar]
- [33].Voepel-Lewis T, Wagner D, Tait AR Leftover prescription opioids after minor procedures: an unwitting source for accidental overdose in children. JAMA Pediatr 2015;169(5):497–498. [DOI] [PubMed] [Google Scholar]
- [34].Volkow ND, McLellan AT Opioid Abuse in Chronic Pain--Misconceptions and Mitigation Strategies. N Engl J Med 2016;374(13):1253–1263. [DOI] [PubMed] [Google Scholar]
- [35].Vowles KE, McEntee ML, Julnes PS, Frohe T, Ney JP, van der Goes DN Rates of opioid misuse, abuse, and addiction in chronic pain: a systematic review and data synthesis. Pain 2015;156(4):569–576. [DOI] [PubMed] [Google Scholar]
- [36].Young A, McCabe SE, Cranford JA, Ross-Durow P, Boyd CJ Nonmedical use of prescription opioids among adolescents: subtypes based on motivation for use. J Addict Dis 2012;31(4):332–341. [DOI] [PMC free article] [PubMed] [Google Scholar]