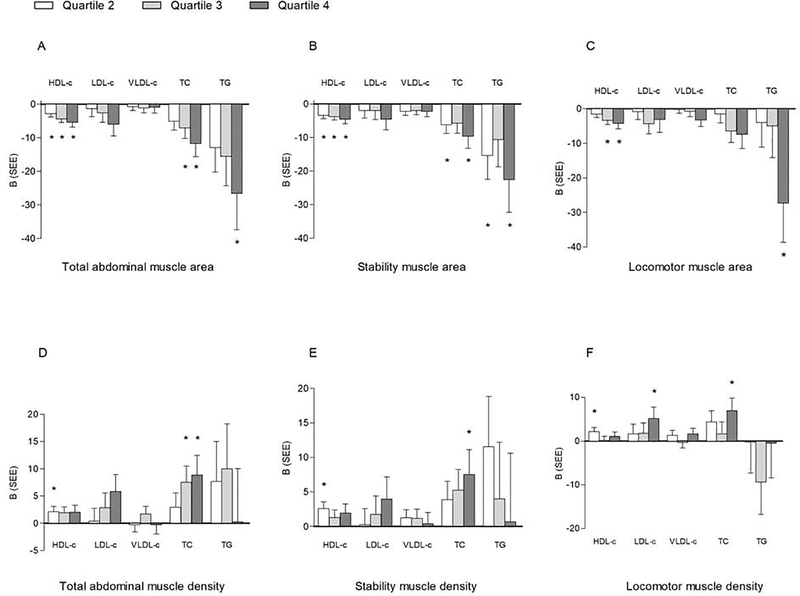
Figure 1.
Multivariable-adjusted linear associations between quartiles of muscle area and density with lipid outcomes; *P < .05; referent category: Quartile 1. Muscle area quartile cutpoints (cm2): total abdominal: Q1<77.02, Q2 = 77.02–94.66, Q3 = 94.67–116.84, Q4≥116.85; stability: Q1<58.20, Q2 = 58.20–72.12, Q3 = 72.13–89.13, Q4≥89.14; locomotor: Q1<17.88, Q2 = 17.88–22.75, Q3 = 22.76–28.83, Q4 ≥ 28.84; muscle density quartile cutpoints (HU): total abdominal: Q1 < 38.17, Q2 = 38.17–42.69, Q3 = 42.70–46.34, Q4 ≥ 46.35; stabilization: Q1 < 35.24, Q2 = 35.24–39.86, Q3 = 39.87–44.06, Q4 ≥ 44.07; locomotor: Q1 < 47.15, Q2 = 47.15–50.84, Q3 = 50.85–53.89; Q4 ≥ 53.90. Data are adjusted for model 3: age, sex, race/ethnicity, height, diabetes, smoking, hypertension, lipid-lowering medication use, moderate-to-vigorous physical activity, sedentary behavior, subcutaneous abdominal fat area, visceral fat area, visceral fat density, leptin, resistin, C-reactive protein, interleukin-6, adiponectin, TNF-α, and total abdominal muscle density. HDL-c additionally adjusted for LDL-c and triglycerides; LDL-c and VLDL-c additionally adjusted for HDL-c; triglycerides additionally adjusted for HDL-c and LDL-c. B, slope; SEE, standard error of the estimate; B, slope; SEE, standard error of the estimate; VLDL-c, very-low-density lipoprotein cholesterol; HDL-c, high-density lipoprotein cholesterol; LDL-c, low-density lipoprotein cholesterol; TNF-α, tumor necrosis factor-alpha; TC, total cholesterol; TG, triglyceride.

