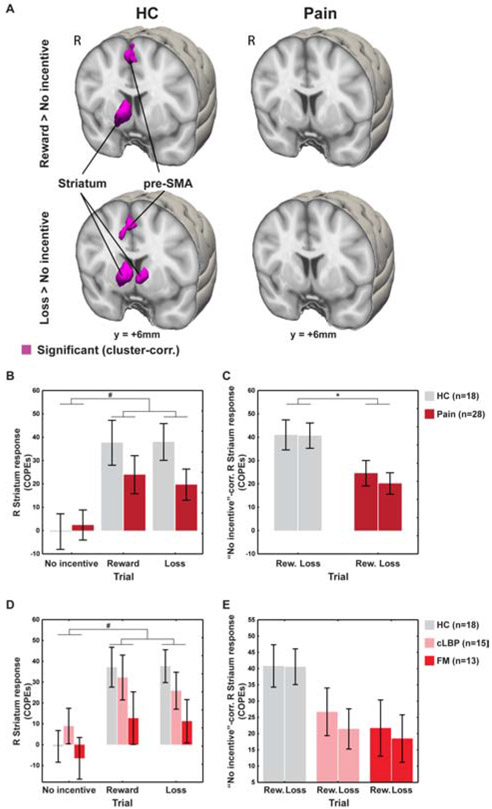
Figure 4: Imaging MID results.
A. Whole-brain voxelwise analyses. B. Brain responses extracted from functionally-defined striatum in both pain and HC groups. C. ROI analyses of the functionally-defined right striatum, using “No-incentive”-corrected COPEs (i.e., COPEs of the reward/loss trials, correcting for those of the no-incentive trials). D-E. ROI analyses using COPEs (D) and “No-incentive”-corrected COPEs (E) splitting the pain group into CLBP and FM subgroups. *p<0.05. #Trial type effect significant in the voxelwise analyses.

