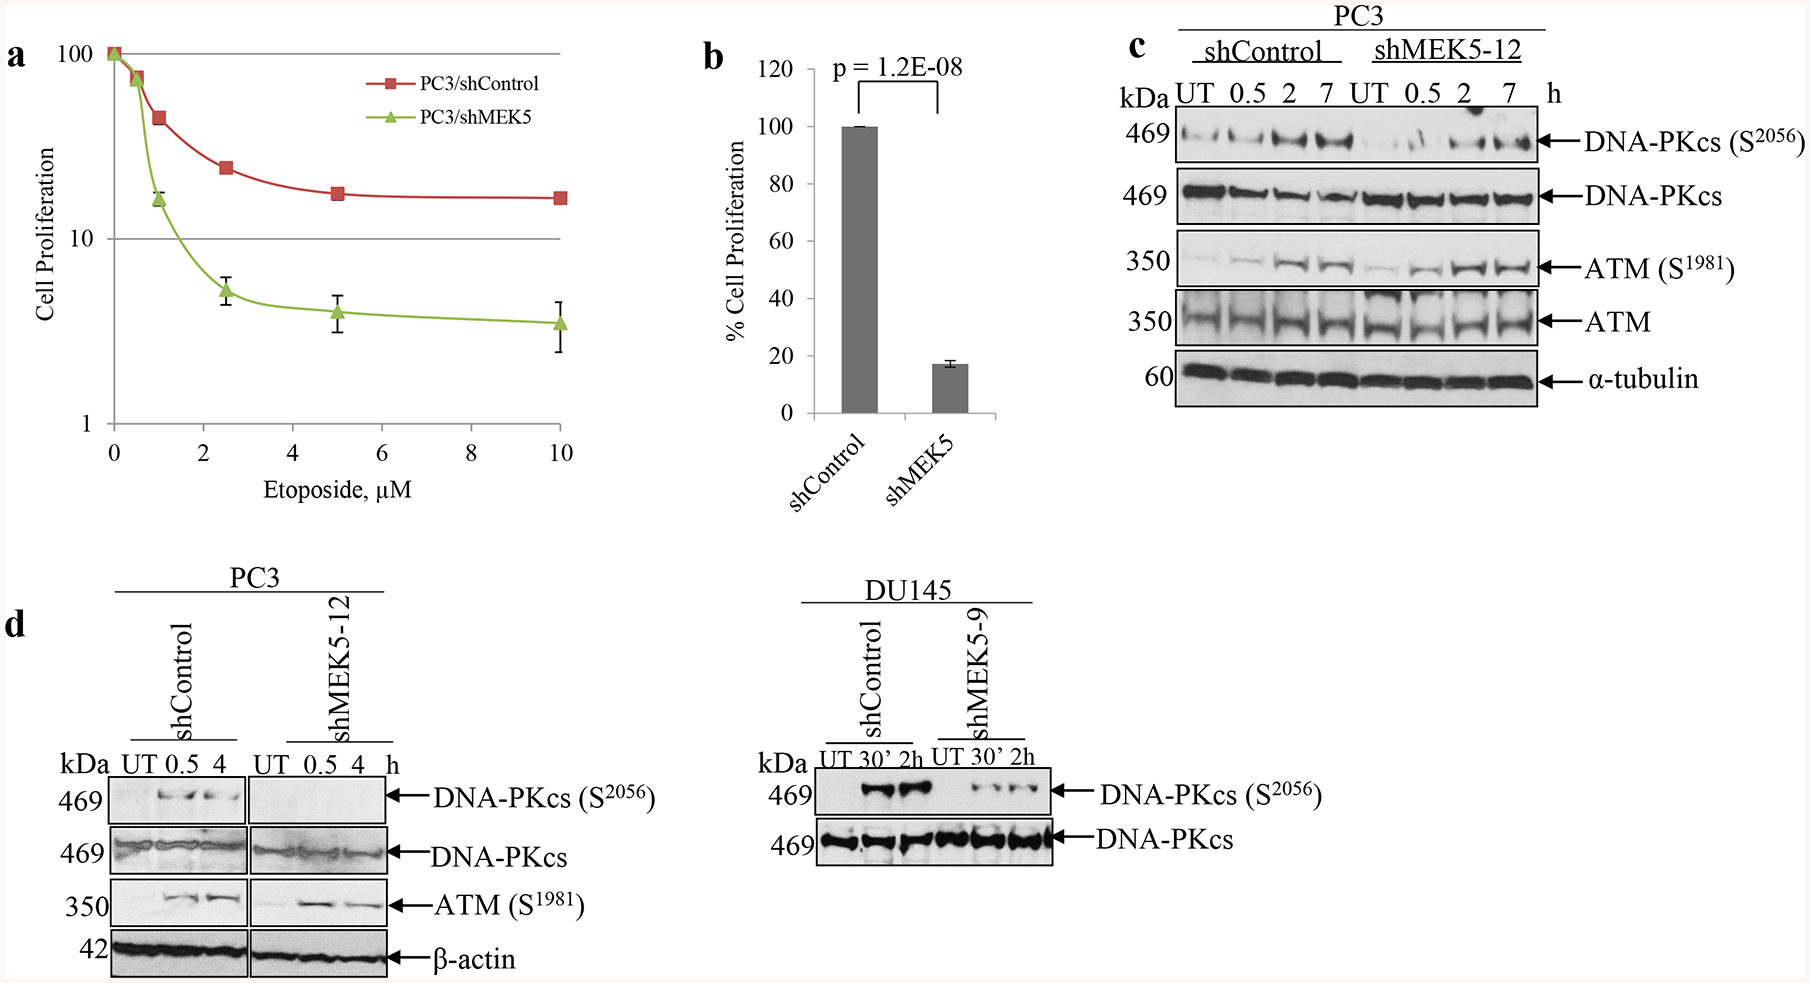
Fig. 3.

MEK5 knockdown impairs DNA-PKcs phosphorylation in response to etoposide and phleomycin. a dose response curves of control and MEK5 shRNA in PC3 cells exposed to increasing concentrations of etoposide. Cell numbers were recorded 6 days post-treatment. b PC3 cells were exposed to 10 μM etoposide for 16 h, drug was removed, and cells were incubated for 6 days. Subsequently, cells were fixed, stained with crystal violet, quantified and expressed as percentage of the shControl-treated cells. Mean ± S.D. (n = 3). P-value were calculated by Student’s t-test. c PC3 cells stably expressing a scrambled (shControl) or MEK5 (clone #12) shRNA were treated with 10 μM etoposide, cells were lysed at the indicated times and immunoblotted sequentially with the indicated antibodies. d PC3 cells (left) stably expressing shControl or shMEK5 (clone #12) and DU145 cells (right) stably expressing shControl or shMEK5 (clone #9) were treated with 60 μg/ml phleomycin for 2 h, drug was removed and cells were incubated for the indicated times. Lysates were immunoblotted with the indicated antibodies. UT: untreated.
