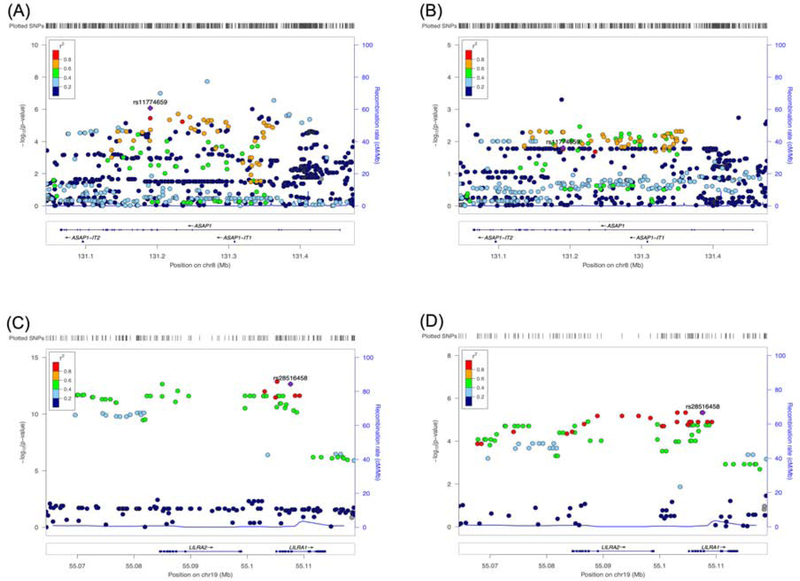
Figure 3. LocusZoom plot for eQTL analysis of ASAP1 and LILRA2.
SNPs’ positions on chromosome and their color-coded association with expression levels of ASAP1 are plotted in ADNI (A) and AddNeuroMed (B). The SNP with the lowest p-value in a meta-analysis (rs11774659) is indicated. The eQTL results of LILRA2 are plotted for ADNI (C) and AddNeuroMed (D) with an indication of the SNP with the lowest p-value (rs28516458) in a meta-analysis.
Abbreviation: eQTL: expression quantitative trait locus

