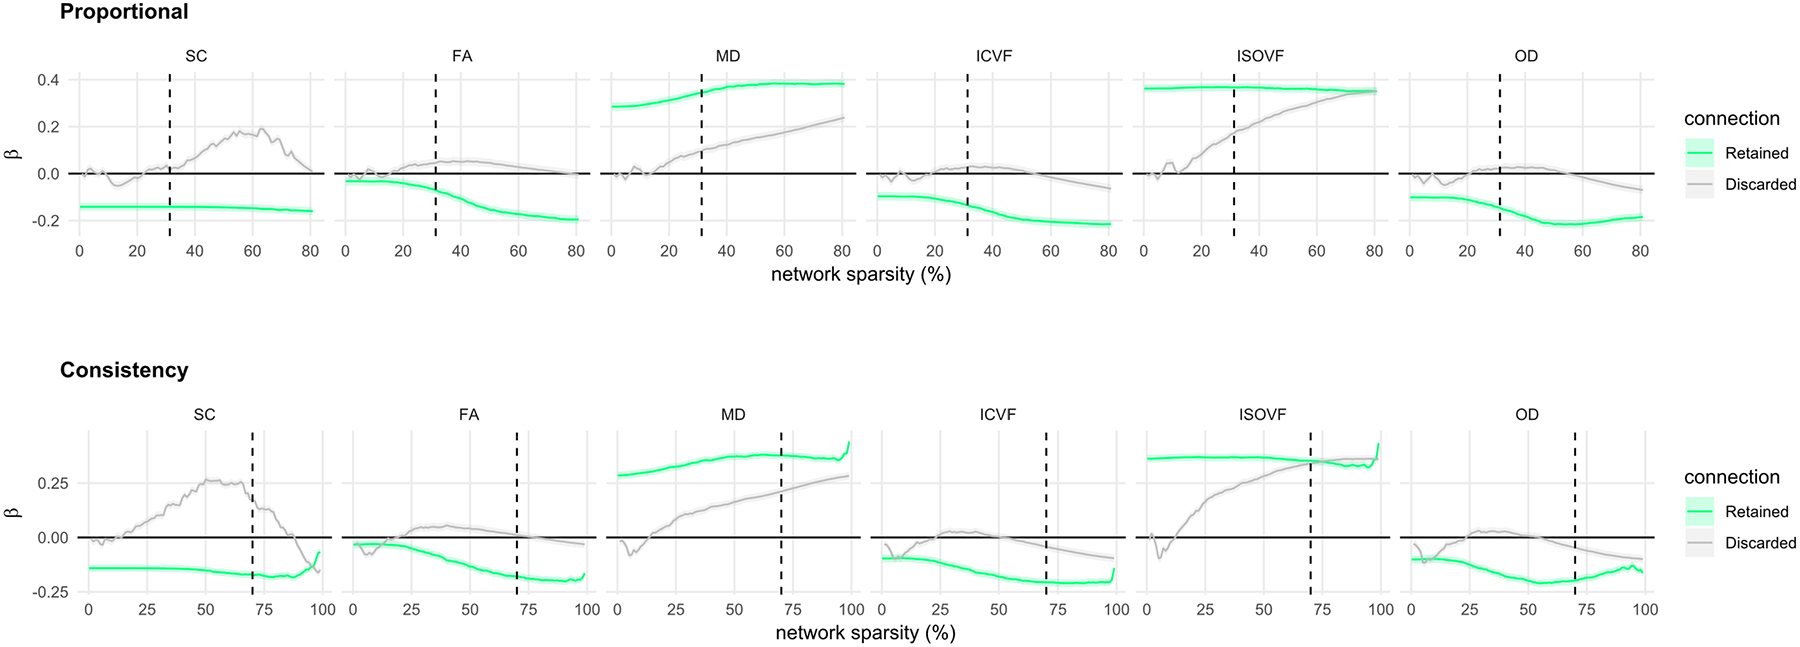
Figure 4.

Age-associations (standardised betas with SE) of mean edge weight computed for both connections that were retained and were discarded and over a range of thresholds (0 to 100%) for each of the six network weightings using: proportional-thresholding (top), consistency-thresholding (bottom). The dashed vertical line indicates the threshold levels for 50% of subjects (PT50) and consistency-thresholding at 30% (CT30), respectively.
