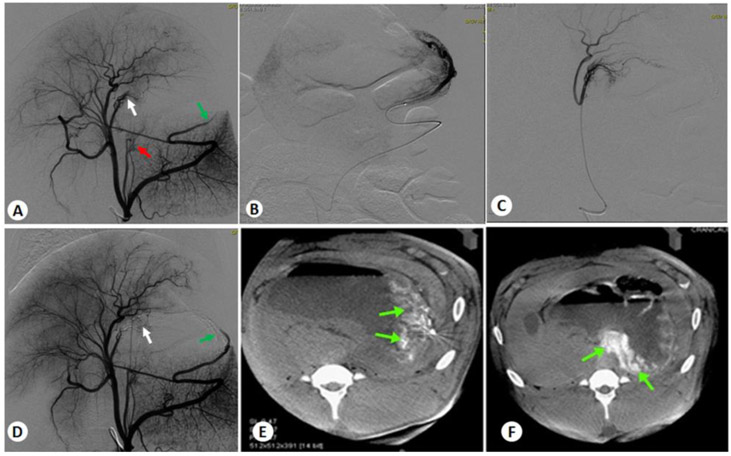
Figure 3.
Representative angiograms of BAE in two fundal arteries. (A) Pre-embolization celiac DSA of the stomach showing RGA (white arrow), LGA (red arrow), and LGEA (green arrow) that supply the gastric fundus for embolization. (B) Sub-selection DSA of LGEA. (C) Sub-selection DSA of RGA. (D) Post-embolization celiac DSA after super-selective embolization of LGEA and RGA, showing the stasis of the blood flow (arrows). (E) Axial view of CBCT images of the stomach after LGEA embolization. (F) Axial view of CBCT images of the stomach after RGA embolization.

