Fig. 2.
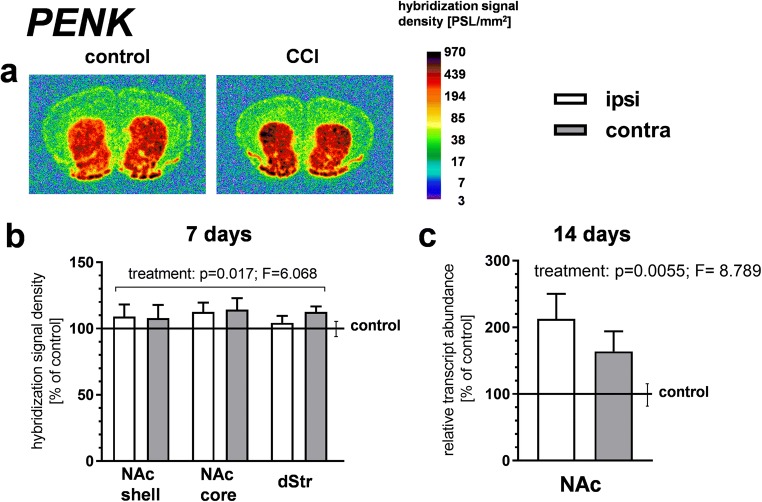
The effect of chronic constriction injury (CCI) on proenkephalin (PENK) gene expression in the striatum/nucleus accumbens. a, b An in situ hybridization analysis of PENK gene expression at 7 days after CCI. Panel a shows representative autoradiograms, where optical densities are color-coded according to the scale on the right (PSL, photostimulated luminescence units). The bars in panel b represent the mean (± S.E.M.) optical densities in the indicated brain regions of the CCI group (n = 6), ipsilateral and contralateral to the injured nerve. The data are expressed as a percentage of the corresponding values in the naive control group (n = 5). The control is indicated by the horizontal line at 100%, and the vertical error bar on the right-hand side of this line represents the mean S.E.M. in the control group. p and F values above the bars are the results of a three-way ANOVA (treatment × side × region of interest [ROI]). All other results of this ANOVA, not shown in the figure, were nonsignificant, except for the ROI factor (which reflected differences in the level of PENK gene expression between brain regions). c qRT-PCR measurements of PENK mRNA levels in the nucleus accumbens at 14 days after CCI. Data represent the mean (± S.E.M.) PENK transcript abundance standardized against HPRT1 transcript and expressed as percentage of control (see description of panel b); n = 8 to 10. p and F values above the bars are the results of a two-way ANOVA (treatment × side). The side factor and treatment × side interaction were nonsignificant. The ANOVAs were performed on raw data. dStr, dorsal striatum; NAc, nucleus accumbens

