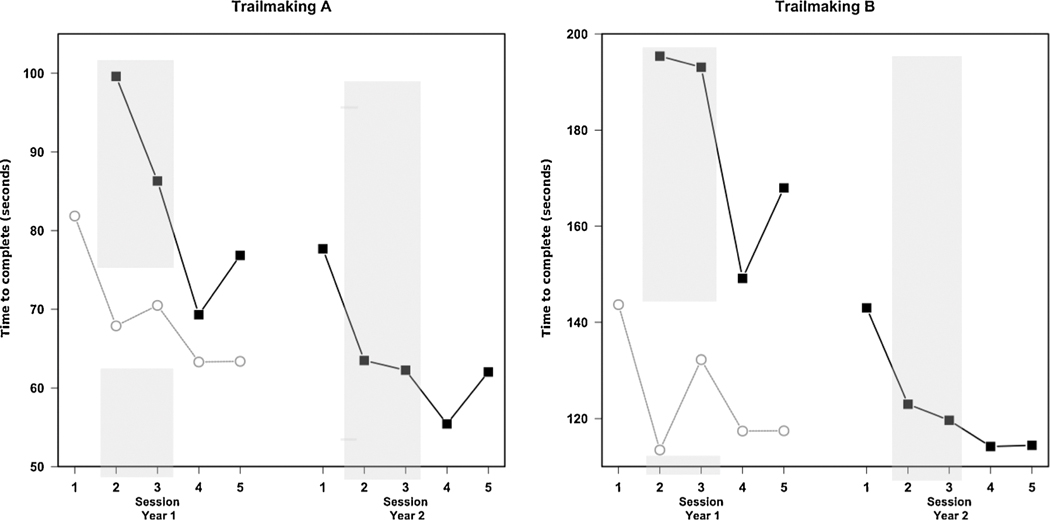
Fig. 8.

Average performance on Trail Making A (left) and B (right) over repeat sessions in years 2009 and 2010 for agricultural workers (black line, filled squares). MOA controls (gray line, open circle) are shown for comparison. The gray shaded columns identifiy the period during which pesticides were being applied.
